
6th September 2017
Another day and more worries over North Korea and a possible ICBM launch saw stocks tumble and the FTSE dip back below the 7400 level. There was a brief pause at the 7375 support area but the bears soon broke through to get a daily low at 7335. The 2 hour chart remains bearish and the coral is now showing a downtrend with resistance at 7423. There is however decent support just below the 7300 level. Services PMI data also showed a slowdown, to 53.2 in August. The services survey also showed that a measure of new business weakened, with respondents citing “fragile” confidence.Does probably mean that interest rates are unlikely to rise anytime soon. There were some rumours of even further cuts instead!
FTSE 100 Outlook and Prediction
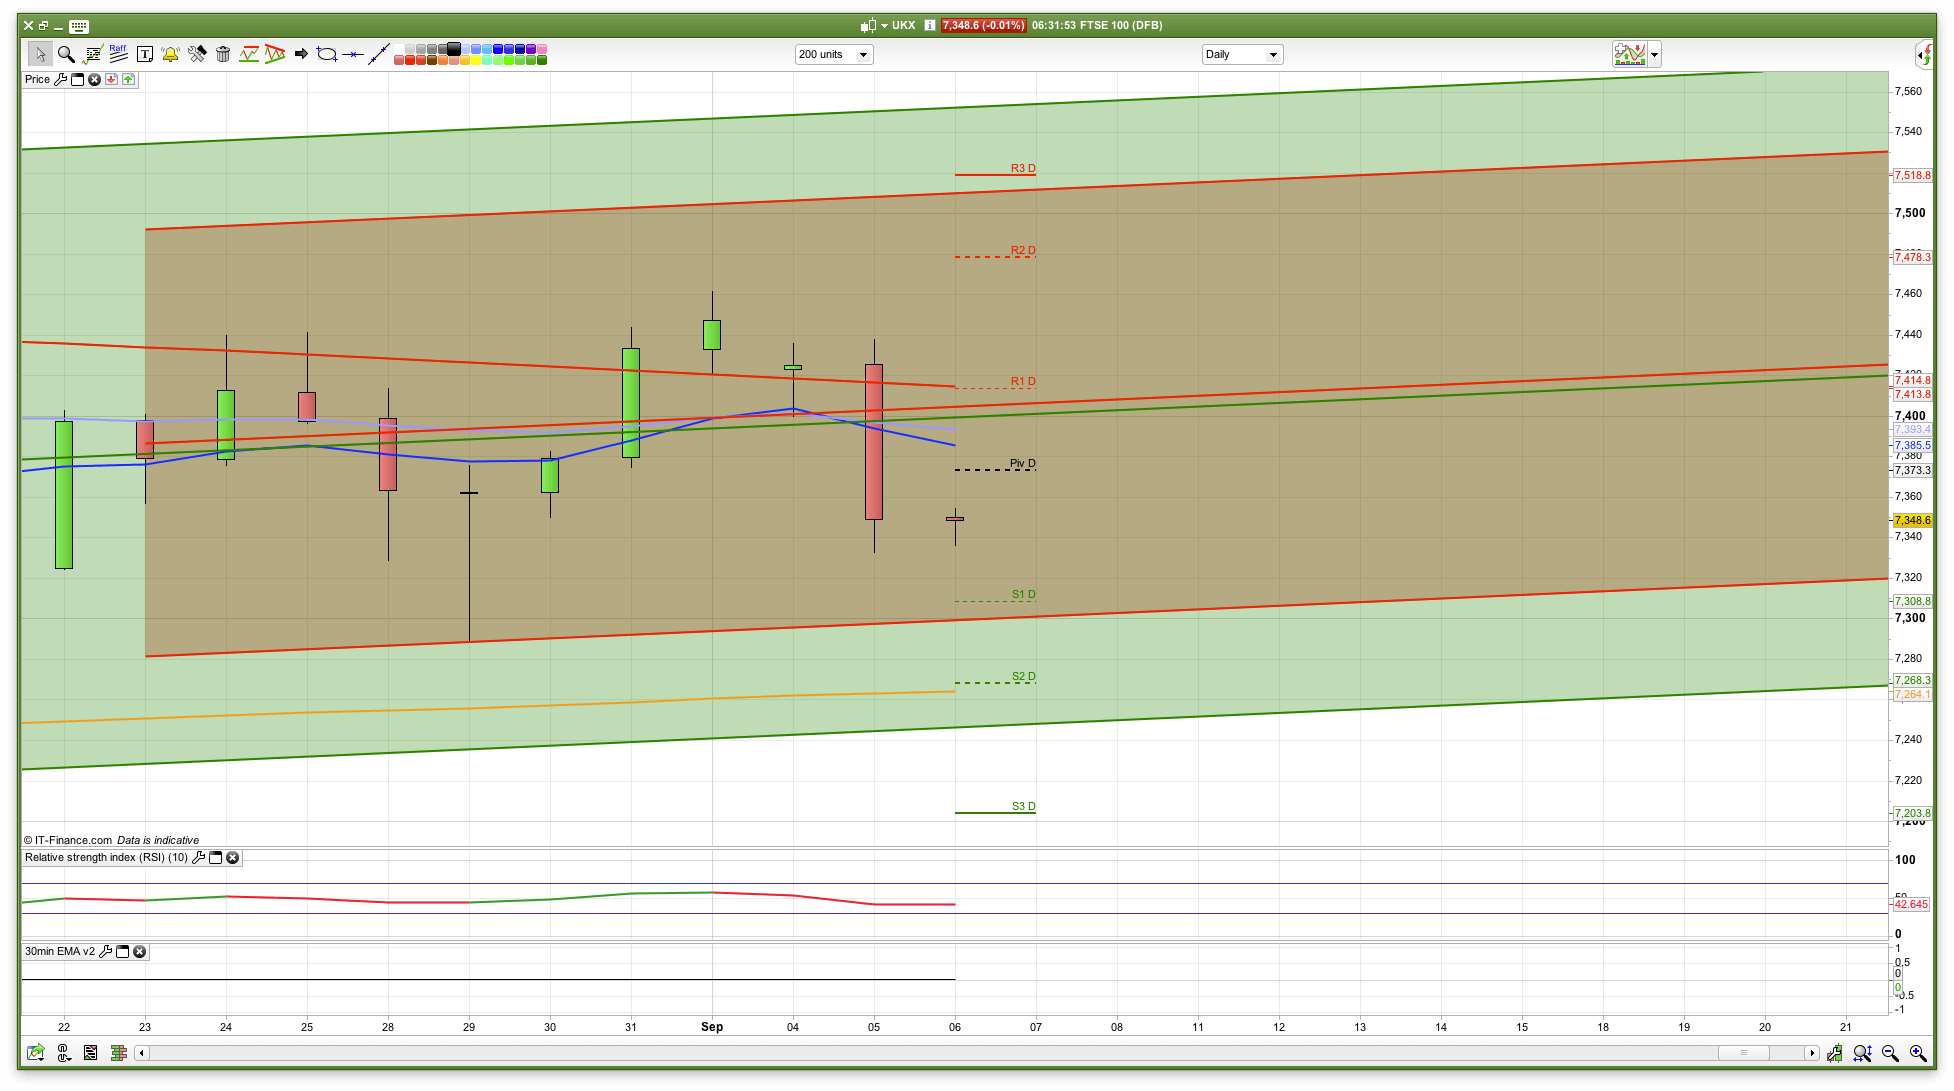
It’s very much risk off at the moment, however there is decent support at the 7300 level as we have climbed from there a few times. Should 7296 break though then there is likely to be further downside towards 7150. The bottom of the 10 day Raff is at 7299 for today, and we also have a fib level just above this at 7317. I am thinking that buying an initial dip is a decent plan, risky though it sounds! I am going to fade in some longs at these levels.
The 30min chart is bearish to start with and we may well see a dip down through the 10 day Bainca support at 7348 initially. There is resistance from the 25ema at 7355 and we have a red coral at 7366 also as resistance. The bulls will be keen to break the daily pivot at 7373 today – it’s just a question of whether they can shake off the North Korea fears.
We also have another Hurricane (Irma) heading towards Florida this time and one of the biggest for a long time, so likely to cause significant damage when/if it hits landfall there. Off the back of Hurricane Harvey the US has many plates spinning at the moment that need to be managed. Irma has also seen orange juice and cotton prices rise.
So, fairly simple plan for today really watching if any early weakness down at 7317 and 7296 gets bought into.
Membership
Want more detailed analysis for FTSE 100, DAX, Gold and S&P? Then please join our active members community.
What you get
- Daily Analysis pre market open (sent around 7am each day) for FTSE, DAX, Gold and S&P.
- Daily email pre market includes my trading plan for the day including ORDER levels, with stops and targets/limits
- WhatsApp and webinars group membership for discussion and realtime trade updates
Yesterday broke through pivot support so bias must be down but support is just below. Got my accounts back running today so staying out until this aupport and resistance resolves itself. Gold has not been a huge beneficiary of the cryptocurrency smash. Would have expected a bigger reaction. But as more nation states clamp down should be good for gold. Which they will. Ignore Japan the majority will seek to outlaw them. Of course by their nature these virtual currencies should rise above mere laws…it will be interesting to see how that plays out.
Anstel I looked back at RSI on daily and whereas it may give reasonably good signals at extremes I would say it is not superior to Bollinger Bands and other indicators which are better visually. Plus you still miss good opportunities if you play only the indicator. But it could be adopted as a strategy to buy an RSI of 20 but you will still be looking at candles for stoploss. Might as well just use horizontal SAR. And heed dow theory of lower lows and so forth. But ultimately its not the tools you use but how you play them.
Morning CM….I tried once having two Ftse charts on two laptops,one with RSI and one without and found I could pretty much tell by price action on the chart without RSI when it was getting overbought….when I looked at the chart with RSI it confirmed it….what I found though was I tended to sell just a little bit too early when not using the indicator so I tend to just wait a little longer now…..this is only if I’m scalping at small size really…. They are all oscillating indicators though and ive tried bollinger bands and found them interesting but they are not on my chart…..I think the real skill in this endeavour is to predict what the market will do ahead of time and position yourself accordingly …….I think it’s about planning ahead before it happens……Homework the night before helps and looking ahead for clues to potential direction…..then just waiting for the higher probability trades….the problem I’m having is Im still lacking discipline to sit and wait….but I have improved considerable over time …good luck….
Give me a naked price chart with a decent hammer or shooting star for trend reversal, a reverse pair, with next day confirmation, or even better a piercing pattern to buy or dark cloud cover to sell. Very reliable. If forced to play an imdicator I would xhoose bollingers as it is a proven statistical approach, you will find the lower line OF BOTH bb AND RSI generate similar signals.
Wow, 2 out on the low! 7319 – I had 7317 pencilled in!