
Good morning. Interesting day yesterday that was pretty choppy as expected. The Dax was very bullish off that 9550 support area, adding nearly 200, while the FTSE stalled at 6900. The S&P dipped back from the 2009 area yet again, and is again sub 2000. Feel like the FTSE is lagging again, though the bulls will need to break 6906 today to target new highs. We also have NFP news out int he US later – always a market moving event, and if it gets the S&P below 1995 then the highs might be in on that now at 2012. ECB news yesterday saw an interest rate cut and more stimulus, just as the US is winding theirs down.
Asia Overnight from Bloomberg
Asian stocks fell, with the regional benchmark index heading for a second daily decline, as material companies slid.
The MSCI Asia Pacific Index slipped 0.5 percent to 148.17 as of 10:57 a.m. in Hong Kong, with about four shares declining for every three that rose. The gauge headed for a 0.2 percent advance this week as reports showing faster growth in China’s service industries and U.S. manufacturing boosted optimism in the world’s biggest economies, and the European Central Bank unexpectedly cut interest rates.
“We’re seeing a bit of profit-taking today following the recent rally,” Ryan Huang, a market strategist at IG Ltd. in Singapore, said by phone. “Investors are looking out for the U.S. jobs data due tonight and the Chinese exports data next week.”
Hong Kong’s Hang Seng Index declined 0.4 percent. Australia’s S&P/ASX 200 Index, South Korea’s Kospi index, Taiwan’s Taiex index and Singapore’s Straits Times Index each dropped 0.5 percent.
China’s Shanghai Composite Index gained 0.3 percent. Japan’s Topix index was little changed after the yen weakened to an October 2008 low. New Zealand’s NZX 50 Index increased 0.4 percent.
The MSCI Asia Pacific Index (MXAP) traded at 13.8 times estimated earnings yesterday, compared with 16.7 for the Standard & Poor’s Index and 15.6 for Stoxx Europe 600 Index.
U.S. Futures
Futures on the S&P 500 slid 0.2 percent today. The U.S. equity benchmark slipped 0.2 percent yesterday as energy producers sank with oil prices to overshadow the ECB announcement.
U.S. data yesterday showed service providers such as retailers and construction firms expanded in August at the fastest pace in nine years, a sign of growing momentum in the broadest sector of the economy.
Applications for unemployment benefits were little changed last week, while a separate report indicated firms added fewer jobs in August than estimated. The Labor Department’s monthly jobs report is due today.
ECB Stimulus
The ECB unexpectedly cut interest rates and said it will start buying assets, boosting the flow of funding for the euro-area economy while stopping short of broad-based quantitative easing. The move buoyed European stocks and sent bond yields negative.
“The ECB move is positive for the market,” said Angus Gluskie, managing director at White Funds Management in Sydney, where he helps oversee about $550 million. “The broader global economic outlook is reasonably positive. In the short term, it’s worth being cautious given prevailing geopolitical risks.”
Ukraine’s President Petro Poroshenko voiced “careful optimism” that talks with pro-Russian rebels in Minsk, Belarus, will set the course for a cease-fire after more than five months of fighting. After Poroshenko met with leaders of the North Atlantic Treaty Organization, the alliance’s Secretary General Anders Fogh Rasmussen said it’s too early to tell whether peace overtures by Russian President Vladimir Putin are genuine.
FTSE Outlook
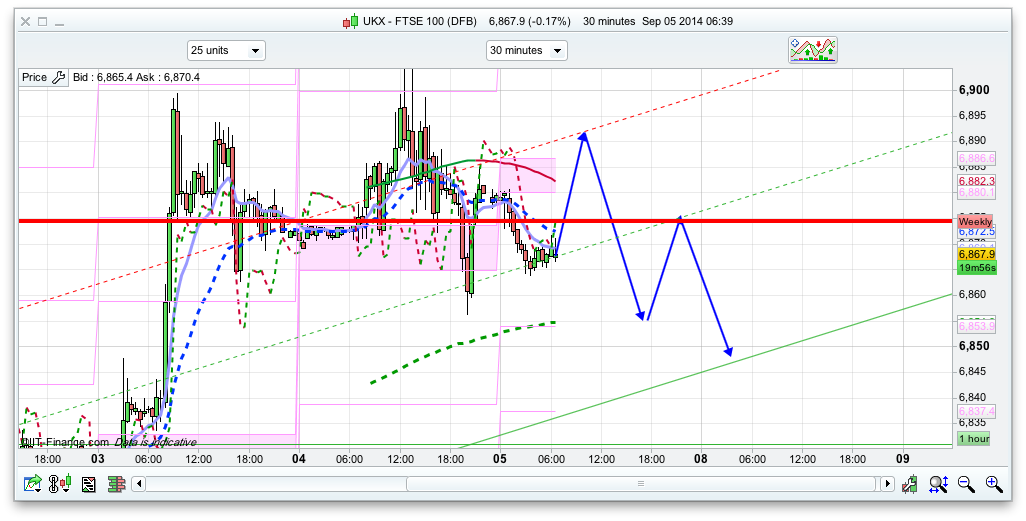
Today depends on 2 things – NFP news and the S&P holding above 1995. Below 1995 and i think it will continue down to 1985, which will drag the FTSE down bit too. Its actually been quite strong in light of the S&P falling off from 2012, so still looks like it might get that rise to 6950, and maybe 7000, 7100 soon! A dip first would be good though to set up a better spring board for a push higher. The daily pivot for today is now resistance at 6883, along with the 6890 level still in play. A break of that will target 6904 and then 6936. On the bearish side, support is at 6854 where we have the 200ema on the 30minute chart, followed by 6842 and 6832, the former is the bottom of the 10 day Bianca channel. We dropped off from the top of the 10 day Raff again yesterday after the second test of that channel in as many days, spa full channel crossing would see prices drop to 6830 in the next couple of sessions.
I have plotted a fairly optimistic start to test the 6890 level before dropping back – from that level I am a bit more bearish again as the S&P is leading the way, though the bears need to break 1995 as mentioned – we have a fairly decent 30min channel wight hat level in play, and the bottom of which is 6850, around that 200ema support level too. With the 20 day Bianca here, if this level holds then we should see the all time high next week, but as I said a lot depends on the US today.
Still holding to my TAT Trades. 2 Ftse 1 S&P
Well I reckon 6845 is a done deal – so Really
we have to look at 6828 as the probable
target for the Ftse. This tallies with 1985 & 1973
for the S&P
6828 on ftse and S&P on 1985 you mean.
1973 on S&P means a much bigger drop on FTSE
I can only think that from the figures generated from
my software – that there will be a bigger drop on S&P
after UK close.
Thanks for your observation
Bulls need to fight back 🙁
PMS
Been looking at the software again. The bigger drop
for the FTSE to correspond with S&P 1973 – the software
generates ftse drop to 6801.
SPX has support at 1988-1985-1978-1967. I’m looking to buy at 1986 today if it reaches there . 1988 probably is major support. 200 ma in the 2 hourly. So 1986 is a short term price
The problem with this, is if NFP comes below, this will boost SPX = no rate hikes sooner
ADP come below yesterday, which usually is a barometer for today. Statistics show that when 1st comes below the other will also and vice versa
*came
I’m guessing 200K
PMS
are you in any trades?
So you are buying S&P at 1986?
Whats your general view of the market as it stands now?
It’s a bit difficult as always… I see a lot of people shorting and also I see that markets need to cool down a bit. Also September is always not a good month and with high prices, I expect a pullback in mid September and a resume of uptrend later on > mid October
Nick, explain me one thing:
you say that the ema at 30 minute chart is 6854. I see you use Prorealtime charts with prices 24hour daily
My chart which is not Prorealtime but standard IG chart with same prices as the ones in the Prorealtime which IG also has, gives me 6852.2 in the 200 ema.
How can it be ? Do you use the prices from IG ?
Nio idea why its different. 200EMA on 30min is the green dotted line on the chart above, 6855.46 currently
You can see it on this pop up too on the charts https://dl.dropboxusercontent.com/u/20168894/Friday/Screen%20Shot%202014-09-05%20at%2011.17.03.png
Long stopped 🙁 anyone long?
Hi, Senu. Heard you’ve had good trades recently.
I was thinking of one on Dow at 10.30, this is where I would take longs in the past (and collect my losses). But my algorithm told me to stay clear of longs below 200EMA with perfect crossover. If the only thing I should have done was looking for shorts, but the train was long gone so I didn’t risk it. And possibly I should have taken short, witnessing the rejection of price at 10.40. (I was distracted straight after so didn’t consider that further). Even if it looked that it was going to bounce off 17064 level that rejection definitely put me off.
Why did you take your long, on FTSE? How do you like Dow?
Jack, FTSE was just a NOTS trade. Dow, I expected a double bottom near 17020, bit earlier entry last night. Should have held that. Will be away from my desk this afternoon. So came out.
Infact I use Omnitrader – Visual trader package – Professional – live with various plugins
Do you have the Money zone plug-in?
dow also stopped 🙁
Hmm….shouldn’t have closed shorts yesterday. Never mind, still got some shorts running from 6900 20/point in ftse and 25/point in snp from 2009. Looking to open shorts in Dax and Dow this afternoon.
good idea. thinking the same
If 17013 holds, then we may have a bounce for the next week. Otherwise – a wasted day. What a shame it just dropped without me on board.
You could be right Jack, all depends on news this afternoon and markets’ reaction, let’s see.
Now that ftse has hit 6828
Software is showing – S&P is looking to break 1985 and hit the 1972
Software has Flagged 6801 on Ftse
So I will keep my trades to this level.
Nice one 😉
142 K – – so the knee jerk move up
is it good or bad? Do you think it is a move up? Don’t really understand what’s going on
So yes looks like 1972
Not the number I predicted but nevertheless in line on what I was expecting, below the forecasts.
Taken another short 1997 S&P
Long closed on FTSE at 6850. Now lets see how the afternoon plays with SPX. I may buy or not.
Need that September pullback
I think FTSE still more to go
Maybe, but happy for today. Not risking to much time in the markets this month, until I see some decent pullback. In the meantime FTSE broke in 4 hourly chart a longer term trend line from the bottom
All other positions Stop at Breakeven.
Sell order on Ftse 6860
You actually thinking it is a short???? But it’s long now as far as I see it (not in trade)
I actually thought it would pop up to 17109
I too have a short order @ day high. Hope it hits 😉
2 x S&P – 2007 & 1997
3 x Ftse – 6992 / 6885 / 6860
Short till atleast 6801/3 & 1972
sorry 6892 not 6992
GL. Unfortunately my short at 6885 the other day was hit by a stop at 6900. I hate shorts, this why I use automatic stops, compared with mental stops in my longs. My mistake was to enter to early. I had to see a reverse candle in the 5 minute chart so I could enter. Didn’t do it.
Short 17086.5, 1/3 of a stake, thought it would pop up a bit higher to 17109
tnh, the lines are not really stuck up for the short on dow, so i am quite cautios atm, may add if chance
silly billy
heh, I am out, wasn’t set for this trade at all. 52 f.. points, if it was my usual stake its only 17. lol however, thank you guys.
FTSE still has an active channel in hourly chart
when it was long on FTSE? do you mean at 6830 area?
well, i wish i had a grand everyday, must be great.
you must be waking up at dawn. great trades. 🙂
RentalCollection, that software still telling SPX to hit 1985 ?
PMS
Yes ofcourse
come on dow break 17000!!
markets still to resilient.
We may not see any meaningful pullback. Only small moves down, like the pattern I see in overall markets. V-Bottom with extension and C&H.
Jim also has the same view
we have to remember, that we had one recently.
So, you mean is it bounce from here?
what you think ? I´m clueless. Only see what charts are saying…see patterns and trust on them
I still think 17300 in mind..
Looks like indices are high on cocaine.
I was expecting this move.. Unfortunately stopped out 🙁
You will not believe me but when I finished my day at 15.00 I thought that it either stays sideways or even pushes upwards. So I wasn’t that surprised tbh.
DAX was so bullish that I thought the drop is not happening today.
Back in short ftse and S&P just for 30 and 10 points respectively
maybe on monday
With that hammer on Friday, am not expecting any decent drops next week. Sometime between last week of September and mid October there might be some decent drops to go long for rest of the year.
Was looking to go long Monday, but I’m a little careful. The FTSE does not like very promising after that shooting star Thursday with a red candle next day. Deja Vu in this zone in the past.
If it was not for US markets that look ver nice for another big move, I did not trust in this run. I need to be careful… SPX ,may go test again the highs, after that record close above 2007, but FTSE it’s another equation. How Monday candle will react is a key. So very careful for Monday, if I wanna trade
You people there in UK, what will happen if Scotland goes independent ? FTSE crashes ? will lag even more the other markets ??
I thought that this independence vote was going to be a non event as it seems did most of the political classes. My personal opinion is that 18th century unions such as the United Kingdom ultimately do not matter in the modern global economy. Of greater importance to Scotland will be joining the EU and potential monetary union.
To answer your question PMS….before we even reach the conclusion of the vote….we now have uncertainty and therefore volatility leading upto next week’s referendum. So from here we could easily hit 6600 by next Thursday. Furthermore if it is yes then in the immediate aftermath could expect a further 2% fall. So looking to 6400 – 6500 sometime in October.
In the medium to longterm expect Independence to have very little effect but that will take 12 months to work through. Another reason why I think the bull market ends in 2015 and we will have a correction of 10-15% at least.
BUt that will need the help of US. ANd FTSE is selling because not only of Scots but the miners and Australia
Surely scots opinion poll is taking its toll starting today!!
Agreed Sam.
True PMS which further highlights the lack of importance of the union in the modern global economy. However any such uncertainity is bad news for any FTSE stock which has large Scottish operations eg RBS, Lloyds etc.
A potential strategy could be a pairs trade with RBS / Lloyds against other UK banks eg Barclays to gain from this event risk.