
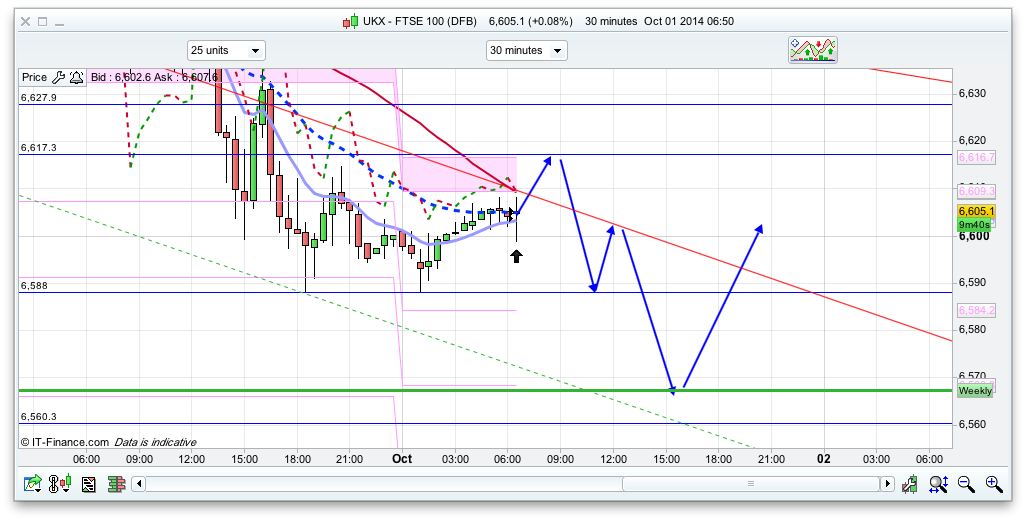
Good morning. The FTSE failed to break the 6655 yesterday, and the long from 6637 didn’t manage to run any higher than that. At least the early morning short got a few points too! The FTSE was certainly jittery yesterday, despite the US being alright, despite consumer confidence declining – the S&P stayed above 1967 and the dow above 17000 (just!). All boils down to the uncertainty over interest rates and when they will rise. The RAF have started combat against ISIS, the Tory party conference have pledged more millions to the NHS, and the protests in HK continue, with no sign of abating, leading to the fourth straight day of losses. For the FTSE the daily channel bottoms are 6580 and 6540 now, with resistance at 6663, and the pivot at 6628. More bear?!
Asia Overnight from Bloomberg
Asian stocks fell, with the benchmark index heading for a fourth day of losses, after consumer confidence in the U.S. unexpectedly declined and Hong Kong braced for bigger protests as Chinese holidays started.
The MSCI Asia Pacific Index (MXAP) slid 0.1 percent to 140.20 as of 9:02 a.m. in Japan after retreating to a four-month low yesterday. The measure capped its biggest monthly decline in more than two years in September amid concern Chinese economic growth is slowing and that the Federal Reserve may increase U.S. borrowing costs sooner as it ends asset purchases.
“There are a lot of worries about when the U.S. will start raising rates,” Nader Naeimi, who helps manage about $125 billion as head of dynamic asset allocation at Sydney-based AMP Capital Investors Ltd., said by phone. “There’s growing concern about the Hong Kong situation. If the protests continue, there’s a risk some businesses may pull out.”
Hong Kong’s Chief Executive Leung Chun-ying faces a deadline to respond to demands for his resignation and for free elections in the city as pro-democracy protests entered a sixth day. As dawn approached, tens of thousands of protesters packed key areas, undeterred by heavy rainstorms overnight. Hundreds of demonstrators had moved to a site in the Wan Chai district where Leung is attending a ceremony at 8 a.m. to mark the 65th anniversary of the founding of the People’s Republic of China.
Japan’s Topix index slipped 0.2 percent as investors weighed the quarterly Tankan survey of business sentiment. South Korea’s Kospi index sank 0.5 percent after a report showed exports rose less than expected last month. New Zealand’s NZX 50 Index fell 0.1 percent. Australia’s S&P/ASX 200 Index lost 0.3 percent. Hong Kong is closed today and tomorrow for holidays, while mainland China’s are shut through Oct. 7.
China Economy
China’s official manufacturing gauge for September is due today, with economists surveyed by Bloomberg expecting expansion to slow.
Futures on the Standard & Poor’s 500 Index slipped 0.2 percent. The underlying equity measure lost 0.3 percent yesterday as small-cap and energy shares slumped amid the decline in consumer confidence.
Confidence among U.S. consumers fell to a four-month low in September as Americans’ views of the labor market deteriorated. The Conference Board’s index decreased to 86 last month, weaker than the most pessimistic forecast in a Bloomberg survey of economists, from an August reading of 93.4 that was the strongest since October 2007.
FTSE Outlook
Feel like it might be a bit bearish to start off with, even though its the first of the month. I did hear a statistic yesterday that today is the 4th strongest day of the year for the FTSE though! There is still a lot of uncertainty around with regards to the economy and how its doing, when will interest rates rise, what about QE, how Europe’s negative interest rates are having an adverse effect.
For today we have initial resistance at 6617, with the pivot at 6628 above that. The mid point of the 20 day Raff is 6635, whilst 6655 is yesterdays high. It all looks pretty weak though and I expect if the bulls fail to break 6617 then we will dip to yesterdays low at 6588. Below that we have 6559 offering decent support and a likely bounce point. The analysis has been slightly tricky today so its a tough one to call, but i think this morning will be bearish.
Just for reference
FTSE 5 Min
6589
RSI<30
MACD<4
That a buy? Just gone long at 88 myself for 6600
Yes Nick
Decided to take this trade 6590.64
Stops are in……
Half off 6600, stop 6594
rest out 6601, now short 6603
Well the software – sell signal at 5614. And target 6584. Seems to have played out.
——————-
So what now.
Well I think that the price action is going to play between 6584 and 6600 for some time.
Best probability scenerio.
Lots will depend on the Dow (ok it always does) but as its close to the 17000 what do we “technically” think are the chances it goes below 17000 today? My own analysis is that it will break with initial support at 16925 which could be tested today?
went short on DAX at 9485 earlier (and just to stick with new blog rules that was posted in yesterday’s thread) and been adding to it when it broke 9500 for no reason imo. So short still on average of 9493 and sticking with that for target of 9425
Hugh ..good morning.
Sorry but Nick decided to call the challenge off.
I was training all last night.
I think I would have won the first round call
sell 6614. Target 6584. ( 1 point off – I am working on that )
Preety cool – right.
p.s. sorry this is not hindsight …. posted on 30th sept page at 8.05am
p.s. Nick .. I am still open for that challenge with you know who.
Noted!
Cool
Morning RC
– I was just getting over the wonder that I’ve finally had a positive trade !! L 6590 – 6600 !
Keep posting the signals as these have been really difficult markets from my point of view …
No problem.
Another sell at 6611 signal.
Quick 15 points made this morning. Next price 6570-6620. Good luck all.
6611 sell triggered target 6590 & 6585
Good trade RC – In hindsight (as always) i should have sold into the rally at 10 points maybe 20 was a bit ambitious? I’ll get it next time.
Taken a short on FTSE 6606 with my 10 point stop
Closed it for 15 point profit.
Just a quick reminder for anyone…
http://portal.ransquawk.com/live.html?code=gYCCEjBxkRcA6bgWCT_Y
Free (5 mins delay)
Any probs – let me know..
Comparative Chart Here @10:25
http://s44.photobucket.com/albums/f25/FTSEDAYTRADER/Mobile%20Uploads/?action=view¤t=ajdicdfe_zps939163a8.png
thanks Hugh.
What is the profit target for anyone short on FTSE ?
RJ
– Initially 6588-85
6571 approx S2 & Fib 3
6559 (Nick’s Support Area)
6539 S3
Daily Support 6535 (Aug 8th Base).
The area from 6535 -6590 was the reversal point in August.
Thanks Hugh. I closed it. Will have to wait for another entry..
88-90 I think
RJ, not trading DAX?
Hi Dutch,
DAX no clear signals but my analysis shows it will test the 9250-200 level. Will look to short it after 12.00. It may get to 9520 again.
I just use PA and EMAs/FIB/Support/Resistance so all the instruments are same from that aspect. I just keep scanning at different instruments whichever gives me good signal which I am like 70% sure, I will take the trade. Still learning..
just closed my short 9425! nearly 70 points, lunch treat!
Excellent Dutch !! No trades for me. Just 15 points from the morning. FTSE stopped out at b/e, I knew it would be 😉
Opps!!!
Software signals Sell 5611 (got to 5614)
software said _ target 6590 & 6585.
opps !”
…
Its now in my RED BOX :-! Ftse cant escape.B-) Its in my control now.:O it will do what i say =-O
( Sorry guys every forum needs a bragger)
_____
I consider that would have been another win for the software.
Cool right.
Hugh
Cant open any of your tags. All i see is just a rotating disk as if it wants to open a page.
Is that the Photo bucket one or the Ransqwark?
This is my analysis. There is a lot of support between 6584 & 6660. Price will really have to break this and I dont think it will do it. Real support is at 6529 _ which is a long way off.
Price is boxed in between 6630 & 6584.
On the upper side if Things go positive 6669 will cap any trend move up.
-________________
I will wait for the software signal and post it for you guys. The signals have been accurate to an exact price value & up to 3 points off. Not bad really
Hugh
Both
Oh OK – just Google
http:/www.ransqwark.com
Not sure about the photobucket – I just posted the tag that comes back on email.
RC – Right click and open in new tab
FTSE Long 6584 – 5 point stop
Stops at b/e..off for lunch..
MLawrrnce
Thanks it works
Exploring a new indicator consisting of upper and lower bounds. The top line is a rolling max. of close and the bottom one a rolling min. Very simple, but potentially useful perhaps in identifying trade entry and exit points. If anyone’s interested I’ll post my ProRealTime code.
http://i1348.photobucket.com/albums/p736/jmca01/Germany30DFB_zps3a4ddcaa.png
Long @70
yep, lost money
I put a modest target and sl, came back from barbers – stop gone.
bit it’s early day yet. we all make mistakes. need to know stop losses as i cannot hedge.
RJ, heh, I need to check though, the smallest stake.
Just for Reference:
5 Min Chart
FTSE 6570
RSI < 30
MACD <-4
Support Areas
6571 approx S2 & Fib 3
6559 (Nick’s Support Area)
6539 S3
Daily Support 6535 (Aug 8th Base).
The area from 6535 -6590 was the reversal point in August.
Index Comparison Chart
Right click – open in new tab
http://s44.photobucket.com/albums/f25/FTSEDAYTRADER/Mobile%20Uploads/?action=view¤t=fdfcdeeh_zpsf4832e4d.png
without stops it’s not a trading.
Hugh
Dont forget the Real Support area at 6529 (software generated). Still learning the nuances of the software. The sell generated at 5611 is still active. so keep this in mind.
5611 ?
there is a prorealtime support trend at 6570
In fact there are two around this area. One horizontal and one trend
Howdy, chaps 😀
How is the roller coaster doing ?
PMS
5611 (Got 5 on my mind) you know what i mean 6611.
Read above for details, if I have put 5611 read it as 6611.
Nick what is at 6559 ? HOw did you come with that number ?
was a bianca level, with stop at 6540
thanks. Do not have that software, but 6570+- there is two lines crossing there from the prorealtime trends
New sell signal at 6579 software generated
FTSE 6579 “sell signal at 6579”
That would make sense…
6579 is 50% retracement of 6591 – 6567 (the last move seen
This is pattern that would only be reversed if we can get a close above 6591..
Good call. looking to long at 6561
Rc I’m with you mate. Noticing IG stats have plenty of people buying so will chase some more downside before considering going long.
Can hear the stops pinging already!
Software sell signal now at 6583
Hi Jim
That indicator is based on what ?
Can you give the code, to test it. I activated today the Prorealtime charts
Sure PMS — I’ll get back to you in a little while.
The original sell trigger at 6689 would have been trigered. Not sure why it moves to 6583.
Read 6689 as 6579
typong on phone
Went long @70 so looking for a 15-20 point turn @85 or 90. Will it get there?
Closed DAX 9407 for 30 pips.
Haha effin hell if I held it I would’ve gone up but I closed it and it drops another 20 points.
Long ftse 5pp 6559
Software support at 6529 – looks like we are going there. I removed my sell at 6579 and placed it at 6583 as per software signal. Um!!
S&P weak – should rally this afternoon?
6545 – would be a good settling point – 1.61 fib
we’ll see
6500 on cards?
Nick , nothing there at 6559, as I suspected
Looks like dow and snp floodgates opened.
THere is a prorealtime trend in the weekly chart that comes in the 6570 area and starts in 2011. It should hold until end of week. If not things can became ugly
today i said, ok i will follow someone, and here it is, i already lost around 60 quid, not yet final. but it’s a lot. we are talking 30-40 points in total.
Jack there is a pattern – no re-tracement has managed to complete a 50% move – let alone a 100%. Until this pattern reverses the bears are running this.
It will switch at some stage & at which point there’ll be a quick exit..
That’s the plan Hannibal !
No one knows what the markets will do. It’s only important that you know what you should do.
Failed at 50% again…6552 (6560-6544)
Hugh
Possible but please see if there is anything at 6529.
RC – I’ve got 6523 – but that a 2.61 fib proj.
What I’ve done is run the Fib from 6577 – 6567 Setting 6567 as the 50% mark…
the projected it down ………
Long DAX 9388 2pp stop 9350
Looks like one way Ahwab. risky one
This market will see 6529 so i will go long there. The software has genersted some fabuloud trades today so really would not back against it.
any buy signal ?
Support Areas
6571 approx S2 & Fib 3
6559 (Nick’s Support Area)
6539 S3
Daily Support 6535 (Aug 8th Base).
The area from 6535 -6590 was the reversal point in August.
Readjusted stop to 9300 going go long on weekly ema 9330 area.
Long dow @ 16890
I have a covering Short from way up that I’m going to lift off at 6534 – if it gets there.
I’ll then be quite Long…
It’s a perfect day for winning, and I am losing. Why did I even contemplated to listen to somebody else when I said myself – never. It must be the last chance thing. I just don’t understand why didn’t I follow my plan – don’t listen.
must be a week of no trading too. i just thought – i give myself the last chance. all i needed was some encouragement that everything will be all right. and it’s like a spit in my face.
now i m not so sure. plus holding this stupid long with no control whatsoever.
Jack relax, where is your entry?
6570, Senu
I too have a lot @ 71
so we are in this together. do you think it will go up without falling more?
I am also long @70 Jack. Let’s see if we can come out of this with a profit. I am even happy to go long again @35. That’s after naughtily changing my price though.
I would have gone long again at 40 and closed at 50. 10p profit could be used to lower bull to 6560.
As i said It’s not important what the market will do. It’s only important that you know what to do.
I can do this though as i have v low risk point to pot ratio
Hi Javed. So you are long until end of the year. -You have been right in those calls, but as anyone else, cannot know the right level to enter. You enter with discipline in end of the month.
As I recall, last time you gone short, FTSE was 100 points up after your enter.
So here we are again. It gone deeper 100 points already after you gone long, yesterday.
But what is important in the final result
GL
Hi Senu, my friend. How are your trades ?
Gone long in DOW ?
GL
yes PMS, any views on S&P pls?
HI SeNu. The 100 ma should hold as always did in the past.
THis area should bounce in next days heavy. It could trade a couple days more around the 100 ma below or above
Bearish imbalance towards HTF-LVN 1941.50 s&p500 Update
Jack, I can’t advice you. But I am hopeful that dow will give a green close today.
dow S3 @ 863. Hope this holds 🙁
Just a small note from my understanding of the OT software is – when a very strong support or resistance is suggested like the one at 6529 presently on thr ftse – the market is not going anywhere before hitting it. Whether it does that today or not I really dont know. But from the price action I wouldnot go against it.
Just a thing to consider for people in a position.
The software gave the sell signal at 6579, however I it moved it to 6583 ( not sure why ) so I am just sitting on my hands to 6529. May never get there .
I love you my fellow traders. Only emotions at the edge…markets always doing tricks
I’ve been doing some studies in RSI divergence in 5 minute chart and found that in between 70% and 100% of the trades trigger are positive.
I collect data from 1 and 1/2 month, from DAX, FTSE and SPX in the trading hours 8 till 16:30. On SPX from 8 till 21:00.
SO here is the deal. After a break below RSI 30, and after exit from the oversold zone, another drop in price with a new low, if you find RSI at +-35 (+-1) , you should go long after the 5 min candle is closed. For the shorts is the opposite +-65(+-1)
The negative side of this, is if the trend is too strong it can break again the RSI below 30 and negating that prior signal, but even in those cases the 2nd time it goes above the oversold and RSI shows +-35(+-1) without another low, it could bounce. This is a deviation but only in rarely cases.
The bottom line is to find that number on RSI. On FTSE is rare but on DAX or DOW or SPX you find more frequently. AT least 1-2 times a week
5 minute chart.
Mlawrence01, Senu, are you planning to hold this position overnight, if yes, will you suggest any stops?
I hope, Senu, wish it was so.
I am happy to close for 15 points Jack. It might go further it might not. It might not get there at all. I don’t use stops or software or technical analysis or indicators so probably not much help there.
PMS
Your findings are interesting. I did a similar look back a couple of years ago and I cant remember exactly what the results were, but there was a definate correlation. Pls keep us appraised on your findings
I had that written for a couple years ago, like that:
RSI 35/65 (-+1) after exiting oversold and with a new low in only 5 minute chart
IF you find RSI 33 or 67, that would increase the risk potential. It needs some sensitive hand and not automated
Ah, those gains I collect is the highs and lows after the signal until end of session. So if you find you are ok with those gains in middle of session, you could exit. If you use 50 points STOP in DAX, DOW and FTSE and 10 on SPX, you will be fine without being triggered for the stupid reason we all know why 99% stops are used (for being washed and see after it reverse and never looking back again, leaving you like a duck) until you place stop at B/E and start to see some real gains appear. Then you should exit, before it reverses to your b/e
Hi PMS,
Here’s the code, between the dotted lines below — just paste it into ProBuilder-Indicator creation. n, present in the definition of rmin and rmax needs to be defined as a variable in ‘Variables’. Click on ‘Add’, and then supply Label in program: n; Label in properties window: Bars; Type: Integer; Restriction: ≥ 0; Default value: 5. Enjoy! 😀
……………………………………………………………………………………….
// Rminmax
rmin = lowest[n](close[1])
rmax = highest[n](close[1])
return rmin as “Rolling min.”, rmax as “Rolling max.”
……………………………………………………………………………………….
Default value: 5 ?
I have max value, min value and step. Which one ?
there is a sintax error when validate program :
return rmin as “Rolling min.”, rmax as “Rolling max.”
Return shows error
Can’t help with that PMS; it works on my machine.
It saids, instead of text, you should use a character
return meaning some character instead
You can change the default value if you want.
ok… i cannot understand what I’m doing, but will test it without any money, to comprehend
It’s a rolling max and min of close. This gives you a band around price. It’s like a Bollinger band if you like, but working on a different technique.
DO you have any statistical ?
I haven’t written a query for it yet – one would need to develop buy/sell conditions.
Here’s another chart PMS to illustrate. The selection is working off a query which throws up interesting situations.
http://i1348.photobucket.com/albums/p736/jmca01/USDDFB_zpsf42ad1c2.png
Jack, I am planning to book it today and will not hold it overnight.
closed the loss -6-7 or something. i have to go, cannot be looking at this any more. it can drop and finish the day on the bottoms. i don’t want to risk with that.
well, typical day, nothing to be surprised off. lost 49 pounds today. not great with the staring balance of 230.
150 points move on Dow and 60 point move on FTSE was wasted today. I actually thought I would get a proper guidance today. All it needed was to say short at 14.30 at that would be it. I would figure it the rest. What the heck that long needed at all in the morning?
too late to start shorting now either.
Jack, I would suggest not to trade around 14:30
This ebola has got this yanks sh**ting their pants? S&P trying to rally.
Jim
Your chart is interesting. Why dont you also add the bollinger band to the chart and see if you can get any visual clues from the differences between your band and bollinger. May suprise you.
Good luck
Thanks RC; I’ll certainly have a look.
Crossings might be interesting!
http://i1348.photobucket.com/albums/p736/jmca01/CHFDFB_zps80f36bcd.png
Hi Jim – I know it’s great being in pursuit of the “holy grail” – but honestly – that chart of GBP/CHF – you’d be better off just putting your skills of technical analysis to the forefront.
Look at different ‘chart set ups’ if you can’t see things for what they are.
Look at Renko charts – they are simply good.
Three Line breaks are straightforward Don’t forget you have to let them close
Look at ‘simple line’ charts – I find these alot easier to look at than candle stick charts.
Look at the re-tracements of each move..
Put 1 or 2 every averages on them.
Just a few thoughts
dow s3 gone, long stopped out
Oh, feel for you. I’ve been in the same boat.
RC
Ref Yr Post:
If anybody is interested I will keep on posting the software signals.
Are you actually trading these signals ??
If not – that should be your next step…
I’m interested in the signals…
dow fantastic 200.
Yes Rental. Keep posting. All posts are interesting and can help make judgments, comparing with our owns. That 6529 support is interesting and we may see that level, as it was the last deep
Discipline is crucial. Almost had an entry signal, on SPX. It was 36+- with new low, 2 minutes before the 5 minute candle was closed, but then it closed deep and in the +-32 zone. Now it will dip further(more probable) or bounce, but not an ideal number
Hugh
Sure am Hugh. As you know I have only been running this for less than a month. A bit of up and down earlier. I persisted and the tweeks and the backtesting took many days of intense work. Last week the results were astounding , some with 95% success ratios. It literally blew my mind.
Why do you think I challenged SYED. Examined whatever trades he was making and they were not showing up as entry points on the OT system. So it was a no brainer.
Very pleased with the results today. That trade entry from 6579 change to 6583 – I, m looking for some reasons for that as I type to you. The miss of the target at 6539 – totally my fault.
Really excited. But I could not have tweaked the system without the years I have spent learning TA, so I am happy the time was not wasted.
Keep an eye on the 6529 , its red hot.
The software is saying what now ? Sell at 6583 for 6529 ?
RC –
the tweeks and the backtesting – I thought that it kind of did it for you – maybe not – so you have parameters that you can change…
That trade entry from 6579 change to 6583 – probably something to do with the swing lows in the morning.
6529 – I’m looking !
Looking for the next close at 18:05. Pray for 34-35-36 zone close below 1952
another 5 minute…still around that area
PMS, you going short here?
Not. Waiting for a signal for going long in the 5 minute chart… not yet and maybe not today again. It’s a rare signal, it will appear but needs patient
Suspect another dip. Not interesting yet for a bounce. The numbers are saying that. Unable to print the sweet numbers.
Hi All….been following your discussions last few days…insightful and have enjoyed a laugh re the syed dynamic 🙂
Not an active trader in the indexes but follow your insights with interest.
Jack2….ive registered to post specifically to give you this message….as friendly advice having read your recent posts. You need to stop, sounds to me that you can’t afford to lose the money and my friend I can promise you if you continue you will squander the inheritance. Please don’t mistake me, I don’t mean to judge your abilities but you remind me of myself several years ago, placing bets without having a methodology based on others opinions….trust me, that is blind gambling and you will end up losing.
I speak from experience having lost around £10k myself doing exactly the same…the highs were awesome but unless you have a logic and understanding of your own it will end bad. Up to you of course but I hear your panic…take some time out…if you decide to keep playing educate yourself..it’s not easy but some basic techniques are not beyond your reach and I’m sure many on this board can give you pointers….
No offence but been there and promise you it’s gambling without your own set of rules and analysis and you need to be honest with yourself.
Respect to all of you and all the best 🙂
Dan
I do agree with you. And I do listen to what you’re saying. It’s from your heart.
I think I lost myself in the last week, it’s more personal reasons but I think mostly it’s my mindset. I did develop my own strategy (printed – displayed), I just don’t follow it 100% as I am very influential by other opinions.
But I do appreciate your advice about money. I know what you mean and think of it a lot. I won’t rush into depositing extra money, I even withdrew just to keep it calm now.
Buy signal on DOW 5 mins?
Tricky with Hong Kong, but long…
Missed most of the action whilst trying to make an honest living 🙂 doom and gloom it seems but I am buying. Just went long FTSE 6335 and DAX 9341
6335?
Having waited to go short totally missed having no access…Typical, the fall I was expecting for a few days has happened without me on board.
6535 havies, thx for pointing out
Good entry, what’s your target?
Short or long term?
Javed, so have you gone long here @6535?
No have dis long at 6625 or thereabouts if I am not mistaken few days ago so he is writing Santa daily now 🙂
Havies, target FTSE is 6600 but I expect that to take a bit so might settle for less depending on market conditions. DAX I might add to if we drift to 9300 tomorrow but I expect a bounce back to 9420 ish as a target
Good for you Javed 😀
Which part of England are you from ?
I would love to visit the English countryside.
HUGH PMS
I think that target was close enough to the softwares 6529.
Its just amasing.
Sorrybtypong on phone
Gave the target early afternoon. Atleast 4 hours ago
RC whats is your software saying ? 6529 was reached after hours
What now ? Any buy signal or only signals in trading hours ?
Yes long at 6625ish……please please Santa Morissey let me get what I want.
PMS – I live in NW London……not really countryside ……..although lots of green. Where do you live?
In Portugal near Lisbon, in Cascais near the ST Julians School where there is an english community for more than a century. It was here were they first introduce Soccer and Golf to Portuguese people and during the WWII there was a submarine cable. Also Nato headquarters are near it.
RJ, you are right, that was just a retrace. I am pleased I got out at right time 6563, it dipped to 6530.
Hi Jack2..Just take it easy and do it slowly..what I have realised is it not the technical ability that will get you money, you will develop that over time..but the discipline to stick to your trading plan..I missed the trade but atleast I am happy I am not being angry with myself having missed the opportunity and opened some random position and sit with a loss which has happened to me in the past. Markets will always be there tomorrow.
Yep, greed kicked in hard on me last week. Normally I would not be going that stupid. But not having a single losing trade for a month and suddenly having one was too much to bear. I read a lot about this now. I just didn’t want to face losses, poor trade management. Being angry of missed opportunity – oh that’s so familiar. It makes you risk recklessly sometimes.
Hope for a better day tomorrow.
Just please tell me RJ. Why they all advice long but missed the short? I wish Nick officially said – it’s short from …. because of …. and I am not closing yet. and then, I closed it right now, because …
No, instead I hear, went long of support, stop loss 20 points. Stop loss hit. Looking weak, let’s try from another support…
What’s the point?
Interesting PMS I always thought you might be from the far east……HK.
Anyway pop over sometime……and if you do please get in touch to meet up (sincerely)…….
😀 already been there. What made you think I was from HK ? 😀
Ofc, who knows ? I only visit London once when I was a kid. Never gone there again. Meanwhile I gone to other places much far way, like Antarctica, Japan, etc.
And Was curious to visit Scotland and some regions like the place filmed by Riddley Scott from the movie Prometheus and also would love to visit the country side and see some of that … old english homes, and small communities. Like Normandie, which I loved very much when I visited in the 90’s
Long dow @ 800 for 17000, 17300, 17500 🙂
closed @ 840 🙂
Good one 🙂
Calling tomorrow to be dip and rise for a long term reversal. Weekly 50ema looks good for DAX, might see 9300, looking to do a Javed and open a long term trade for a few hundred points into the year end.
Ahwab, I thought reversal happened here 🙂
I don’t think Senu..its just us retail traders pushing it up 🙂
Javed, what is your model predicting for October.
Sam as you know I don’t look at end of October as a target….but broadly 190 points above Sept’s close…..so around 6750 – 6800.
Yes Javed, I know 🙂 thanks. Am looking to build my longs but am watching snp to settle down a bit.
Again long @ 805 for my funny targets 😉
😀 I love this discussed page, when they started to build there longs for the Christmas rally. Only here I see that 😀
Hi all
Just got home. Taking a peak at the market, so it did hit 6529 after all. There appears to be no ambiguity, no subjectiveness, just a price level. I still find it difficult to understand how it does it. And I am not complaining.
Does seem rather accurate RC! Thanks for posting the levels
Just a message for Nick. Keep up the good work! Been on this site for about 2 or 3 years. Has become part of my daily routine wherever in the world I happen to be. Some good posters and characters here on the forum.
Running a forum is a legal minefield.
Illegitimi non carborundum
Cheers Javed, it sure is, fortunately the T&C’s are tight. Illegitimi non carborundum indeed!
Am I banned?