
Good morning. Well yesterday ended up being almost a carbon copy of Wednesday and again, somewhat unfortunately, I was too conservative with the opening drop. Still, we got the rise to 6583 before more downside kicked in, somewhat annoyingly just missing the order at 6585 (I had 6588 as the resistance so thought I had set enough room, still if it was always that easy to predict…) the long order just missed too, sitting at 6525, and the low was 6533. Ever feel like some days it just isn’t your day!?! Been fairly quiet in terms of major news as well apart from jobless claims falling unexpectedly yesterday not moving things that much, so it all feels like its coiling up for a big move soon, and probably just being propped up so that the Q3 figures are alright. Maybe that’s me just being overly cynical though. Once Q4 starts early October might get bearish, as yesterday, looking at the S&P could well have been set for a break of 1695 (they tried) before it snapped back to 1700….. again! Bulls are certainly defending that level at the moment.
Asia Overnight from Bloomberg
Asian stocks are headed for the best monthly gain since September 2010 after U.S. jobless claims unexpectedly fell and Japan’s inflation accelerated to the fastest pace since 2008.
The MSCI Asia Pacific Index rose 0.2 percent to 140.83 as of 12:22 p.m. in Hong Kong, as all 10 industry groups advanced. The gauge climbed 8 percent this month through yesterday, touching a four-month high on Sept. 23, after the Federal Reserve unexpectedly maintained its stimulus program. It has jumped 7.7 percent this quarter.
“The U.S. jobs data was a positive surprise,” Mark Lister, head of private wealth research at Craigs Investment Partners Ltd. in Wellington, said by telephone. “I don’t think the Fed will do anything until December as they’ll want to see not just one good data point, but a series of steady improvements. It’s been a very solid quarter for markets.”
The September gains pushed valuations on the Asia-Pacific gauge to 13.7 times estimated earnings yesterday from 12.7 at the end of August, according to data compiled by Bloomberg. That compares with 15.4 for the S&P 500 yesterday and 14.3 for the Stoxx Europe 600 Index, the data show.
First-time claims for unemployment benefits in the U.S. dropped by 5,000 to 305,000 last week, Labor Department data yesterday showed, compared with the 325,000 median forecast in a Bloomberg survey of economists. The government’s final estimate of U.S. growth showed that the economy expanded at a 2.5 percent annualized rate in the second quarter, unrevised from the previous report.
Dax
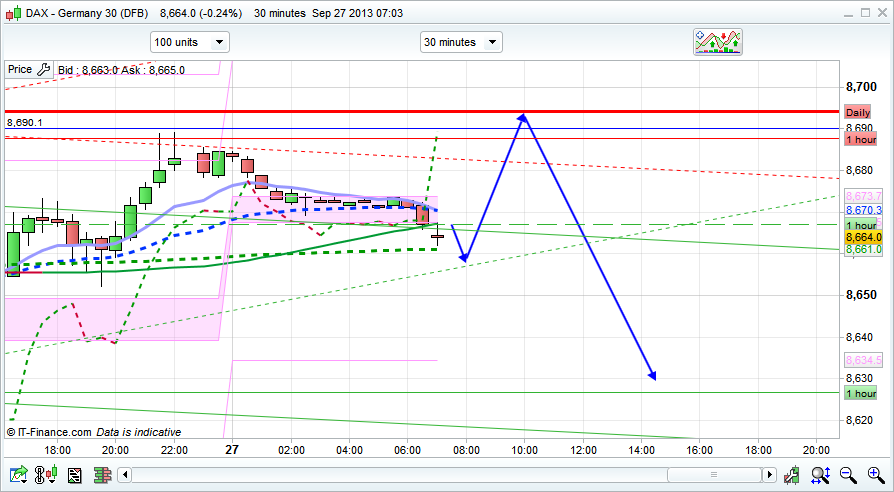
The DAX continues to plod along in a fairly narrow range with the top at 8699 and the bottom at 8600, a break of one of those levels should get things moving a bit more, though all the while it bounce between the first resistance and the first support is good for picking up points. If the DAX can get above 8664 (currently where it is as I write this) it should hit the daily ProTrend line at 8694. Breaking that will get bullish for a while. Support is at 8600, break that and it gets bearish for a while instead! I have put a drop off from the 8695 area with the blue arrows below as week end, month end, quarter end could see some profits being booked after a fairly decent month/quarter and I think we may see a test of the bottom of the 20 day Raff at 8590.
FTSE Outlook
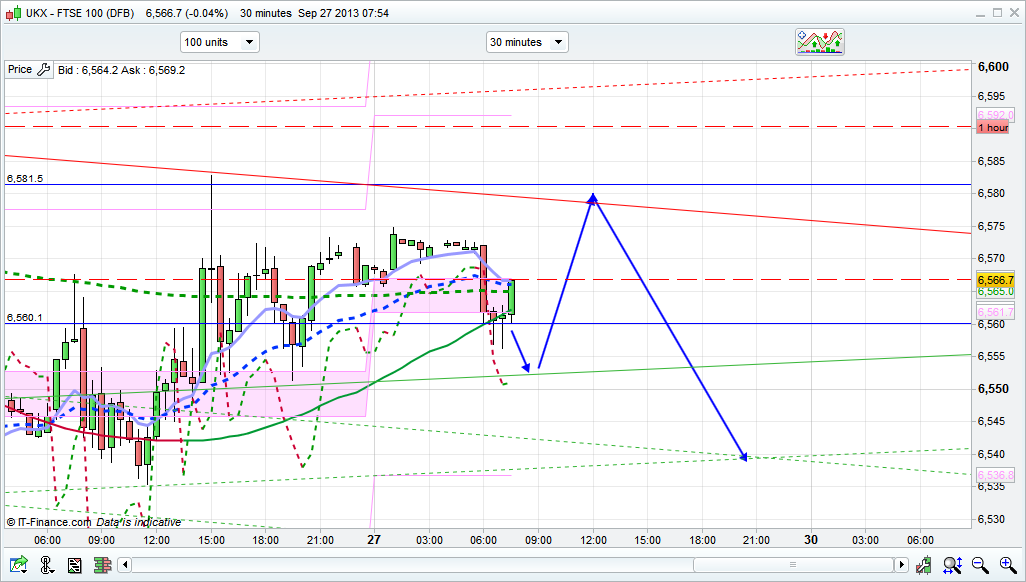
We look to be opening bang on the pivot at 6560 but with a fairly bearish looking EMA situation on the 30 minuet chart. They are just in the process of crossing as I write, so we could be on for an initial dip. Again. That said, the coral is also lending support at this level and is still green, showing an uptrend. Just looking to the S&P there is still significant resistance at 1703 and if that holds, and the bears can break 1695 it could well drop to 1680. For the FTSE I am going for the drop of the resistance level again, rather than a break through and then a dip to test the bottom of the 20 day Bianca at 6543. For the open indicators point to a possible drop but there is support at 6560 so it may just pop up to the 6580 area on the open instead. As with yesterday it’s a tricky one to call accurately. Bottom line support is the same as yesterday at 6525 where we have the bottom of the 10 day channel, whilst the Raff channels are a lot wider – support down at 6450 currently on both, but with 10 day Raff resistance at 6615. Basically I am thinking Dax will drop off from 8690, FTSE from 6580 and the S&P from 1703, for the same reasons as mentioned in the DAX section above – month end, week end, quarter end so getting some profits banked. I am therefore more inclined to stay bearish and look for short entries at the moment.
Fairly negative bias this morning. Does anyone have any views/knowledge/insights re the US fiscal cliff?
Got stopped out twice this morn :((
Mee too 🙁 … looks like every 3-5 pts is a short only… lolss
Why did you try long anyway? Classical short Friday pattern I’ve seen many times. This one is perfect.
Jack both FTSE & DOW appear to have consolidated and settled at current levels past couple hours… I think Longs into US open is a good bet
so it wasn’t a good bet, was it?!!lol
Trying again, long at 6505.. 15 point stop
German CPI below expectation.
Just closed for 5 points, not sure where it is going..
Gap Fill on DOW / S&P? Could see a brief rally over next couple hours
A long possible from here for upto 13:30, SL day low
SL hit out 🙁
You had too small SL. I always put 10 points first.
At 13.13 it was still a tiny falling trend. You should have waited till 13.24 to try long from 6505.5 and look where you would be now.
How long have you been trading, Senu?
last 5 months
Thanks Jack, I will try few paper trades before I use this in live. 🙂
I see, so you are still learning. I started trading 2.5 years ago and now I’d say I got a lot of knowledge of stuff but still have emotional problems in trading so it keeps me more or less on b/e. Last time I lost my account to the full was a year ago. I hope to get better.
Jack Two, I am very much a new trader, also losing as everyone did, pls give a caution if I am doing anything against trend. Thanks
To find the trend is what we are trying to do. At least me trying. Once some trader gave me advice – you have just bought the top of the falling trend! I didn’t know what it was but it helped me to investigate. I read some tutorials on some sites about it. Those lines of channels are magical. Plus I like crossovers and the position of 200EMA. If 10 and 20EMA are below 200EMA, it is more likely to be a short trend and otherwise.
Look at 1 hour chart. Put 10, 20 and 200EMA on it and see that the crossover of 10 and 20 happened below 200 so it pushed down. (the same for 10,20 EMA being above 200EMA for long positions).
But I need to admit this is just an overall guidance. The lines are there to be broken at some point. But can you imagine how long it will take for 10 and 20 EMA to cross back up – it may take a couple of days, not today I am sure. At the moment they are strongly going to some point of price down and not moving up at all. It can only mean that any longs could be short lived and you need to be careful.
However the idea of long the next week from 6480 area could be a good idea when the set up will appear for it, when it bumped several times on the bottom and rejected the prices of support, then it may push up.
But it may break down even further. Until the trend turned it may carry on to the outer channel line etc. You never know where it may end.
I hope it may sense.
looks like 6480 is not too far today
If you give me your e-mail I may drop you a line and some links that helped me. And then you decide what you like and want to use. I may do it after the weekend, but I will.
senu_25ATyahooDOTcom
ok
Going long at close or just before, to get on mondays bullishness.
Did you went long?
good call….i’ll wait to short monday 😉
Now that was scary, no more for me today
What a move in 5 mins… dow moved only 25 pts, but FTSE speedy 20
Ahwab / Jack Two, is going long advisable here ?
Depends on your timeframe Senu, etc. But have a look at this [Dow 1hr].
Right click – [Open in new window]
http://imageshack.us/a/img541/6319/79tx.png
Thanks Jim, Dow is recovering.
Jack two
Hi can I get the website were you learnt from and some advice am new to this.
Thanks
Jack two
My email is zahir112@live.com
Please thanks
OK, I will do so after weekend. But don’t get too excited. Apart from the sites and books it is experience and help of the other traders that matters.
Things looking weak to me i’m short stop 6575 target 6300
I will be looking to go long at the close on Monday. The current levels are still a bit high. We may go lower……even finally hit 6338 in October. However I expect we will be trading higher on the 1st trading day in Jan 2014 than we closed at on 30th September. Statistically that has been the case 76% of times in the previous 30 years. If I can pick up 2% I will have met my target for the year. 6650 by the year end seems a conservative estimate.
Hi Jack Two, could you also pls email me the sites you found useful. Tejgill@live.co.uk
OK, I will do so after weekend. But don’t get too excited. Apart from the sites and books it is experience and help of the other traders.
been gambling since jan this year. currently out of the market and hoping for a rise so i can short again. ‘Just’ £735 from b/e after being £18k down! would’ve been in profit now if i hadn’t closed my short too soon :/
Good to hear you have recovered your losses trying to get back my own losses so far i am adding to them… how will you take measures to ensure it dosent happen again….has your confidence as a trader been damaged..it takes some patients and time…. all the best in your future trading lol
Thanks John. I’m not sure whether trading/gambling’s for me, I may give up if I break-even. i only ever go short so got badly burnt on the rise of the ftse (world events happen!). I simply got lucky as the market peaked and dropped. To answer your question, ‘yes, my confidence is damaged’. I know I’ve been lucky and the sensible thing to do would be to stop asap. Over-trading is a problem for me and adding to losses blew my account a number of times. I don’t have the emotions under control either. I find it hard to close losses and difficult to leave winners to run. If i continue to trade I need to limit my £ per point to a more manageable level to help keep my emotions in check. I’ve had limited success with stop losses, maybe I need to concentrate on this area of trading more.
All the best to yourself & everyone here.
p.s. I see myself as a gambler and not a trader and i don’t recommend my way of trading at all to anyone !!
You need to try to go long sometimes 🙂 It’s been a bullish market this year so you’d have a lot of long opportunities.
I think you need to consider to look more into stop losses area. I think this is a key of success. Every time I forget this rule it drops me back in my account.
Well done C59 good recovery.
thanks Luke
Is anyone on here in profit for the year…??!
for this financial year, Yes. For the calendar year, No
Al – I am touch wood. Will post my p&l here at the close on Monday.
Going to have to change my stratagey if i am to continue…….one example from this week of a bad trading move…..after no tappering was anonced dow jones made all time highs:so with 3ppp on dow to come down was to me an excelent bet so got in somwhere around 15600 went up a little bit after but had enough to cover…then on some of the following days ftse presented what looked as a quick 75 points up.At this stage dow had only moved slightly in my favour… so i thought if ftse is going to go up dow will move up as well which would be against me…so proceded to cancel dow and put a 20 ppp on ftse had not enough in acc to leave 2 runing , ftse moved in my favour about 15 points then started going down,held on as long as could closing out at a loss on way down, in this time dow started to move in my favour lossed my position on dow . Best move their was to leave well enough dow moved over 350 in my favour with 3ppp was 1050 pounds with the 20ppp i put on ftse would have been 7000 pounds all money back in a few days …..need to suss out good positions put on a bet and close up shop… because when you are constanly watching positions inthat case you may have taken 1000 pounds thinking it will move back again so better close up cheek now an again on mobile or tellytex you could be doing something else until your investment reached its full potencial GL
Ok here is my market overview, i am trading longer term now as i dont have time for short term analysis. Ftse finished the week at the low of the previous week and notably a sllight market breadth bearish divergence is seen. The dow finished below last weeks pin bar low again bearish and is sitting bang on 20wma. Sp500 not looking quite as bad but both have pulled back sharply from record high. Many ftse traders are probably expecting a new high but given a failed attempt already i suspect that might be false hope. IG insight shows 64% long which also supports this theory. Therefore i am currently positioned short stop at 6575 target 6300 risk:reward 1:2.66. Happy trading all..
Think the news from Italy could cause further falls next week Al so could be a good shout. I always look for 3 signals before entering a trade and my third is always ‘Am I going against the majority on IG?’. If the answer is yes I enter the trade
Totally agree IG insight was my final trigger…
A medium-term view:
S&P 500
Direction: Down
Last max: 18/09, 1726
27/09 level: 1692 (-34 pts; -2.0%)
Dow
Direction: Down
Last max: 18/09, 15672
27/09 level: 15268 (-404 pts; -2.6%)
FTSE
Direction: Down
Last max: 15/09, 6659
27/09 level: 6508 (-151 pts; -2.3%)
In all three cases, the current retracements are still underdeveloped, compared to the previous two pullbacks with lows in late June and August. Reversals are always possible, but I think the balance of probabilities is in favour of extant patterns maturing further. 😉
Genuinely when someone doesn’t be aware of after that its up to
other visitors that they will assist, so here it happens.
Right click – [Open in new window]
http://img18.imageshack.us/img18/9681/xtsa.png
🙂
I wonder where do you get information of people’s positions on IG? Do they show this info when you logged in? I have never seen anything like this on CityIndex.