
Good morning. Well we had the dip and rise yesterday as per the plan, but if I had expected it to climb all the way to 6400 in the one session I wouldn’t have closed it. Good day for the bulls yesterday showing a bit of escape potential from the recent drops, though still some way to go to change the longer term daily Raff trends to up, though we are breaking through the top of the Bianca channels at the moment. Things still looking grim for Tesco, who reported dire sales figures yesterday. Good job the FTSE didn’t decline otherwise they would have had the blame!
Asia Overnight from Bloomberg
Asian stocks rose while credit risk in the region retreated to a three-week low after U.S. shares jumped the most in a year. Australian bonds pared a decline as inflation slowed more than estimated.
The MSCI Asia Pacific Index climbed 1.1 percent by 12:20 p.m. in Tokyo, as Japan’s Topix index added 1.8 percent and the Hang Seng Index increased 1.1 percent. Standard & Poor’s 500 Index futures lost 0.1 percent after the U.S. gauge surged 2 percent, led by Apple (AAPL) Inc. The Markit iTraxx Asia index of credit-default swap prices fell for a fourth day. Yields on Australia’s 10-year bonds climbed five basis points after rising as much as nine. Gold traded near a six-week high on Diwali festival demand.
Boeing Co., Simon Property Group Inc. and Xerox Corp. are among companies reporting earnings today after Apple’s forecast of record holiday sales drove the biggest gain in the Nasdaq 100 Index since January 2013. The European Central Bank bought Italian debt yesterday, people familiar with the matter said. Core price growth in Australia slowed more than economists projected last quarter, with U.S. inflation data due today ahead of worldwide preliminary factory reports tomorrow.
“The bottom line is Japan and the ECB will fill the gap filled by the Fed,” Shane Oliver, head of investment strategy at AMP Capital Investors Ltd., which has more than $136 billion under management, said by phone from Sydney. “It looks to me like a typical correction market. Sentiment gets pushed to a negative extreme, markets become undervalued again and smart investors find opportunities to buy back in.”
Bond Buying
Technology companies were the three biggest supports for the Asia-Pacific (MXAP) stock gauge today after Apple’s sale projection and as Yahoo Inc. reported earnings that beat analyst estimates.
Taiwan Semiconductor Manufacturing Co. gained 2.4 percent, Tencent Holdings Ltd., operator of China’s biggest messaging service, increased 2.9 percent and Samsung Electronics Co. (005930) rose 1.6 percent.
Hong Kong shares climbed for a fourth day. The MSCI Hong Kong Index rallied 3.1 percent in October through yesterday, the most among 23 developed markets tracked by MSCI Inc. and one of only two to gain.
A gauge of Chinese shares listed in Hong Kong advanced 1.5 percent, heading for the highest close in two weeks, while the Shanghai Composite Index advanced 0.5 percent. China’s benchmark money-market rate fell for a sixth day, signaling fund injections by the central bank have boosted cash in the financial system.
China’s economy remained in a “reasonable range” in the first three quarters of this year, the central government’s website cited Premier Li Keqiang as saying at an APEC finance ministers meeting.
U.S. Shares
Japan’s Topix gained 4.3 percent this week after falling 5.3 percent last week. The measure is still down more than 7 percent for the month. The Nikkei 225 Stock Average climbed 1.7 percent today.
The S&P 500 climbed the most since Oct. 13 last year as Apple climbed a third day and investors speculated the ECB would increase its stimulus program. The Dow Jones Industrial Averageadvanced 1.3 percent and the Nasdaq 100 surged 2.6 percent, the most since January 2013, as about 7.2 billion shares traded hands.
Yahoo shares rose as much as 4.8 percent in extended trading, after closing at $40.17 in New York. The stock is down less than 1 percent this year, compared with a 5 percent gain in the Standard & Poor’s 500 Index. For the third quarter, profit, excluding items such as stock-based compensation, was 52 cents a share. Analysts had projected 30 cents.
ECB Speculation
The Stoxx Europe 600 Index jumped 2.1 percent for only its second advance in 11 days. The ECB bought Italian covered bonds as it returned to the market for a second day under its asset purchase program, according to two people familiar with the move who asked not to be identified because the information is private.
The ECB could make a decision on adding corporate bond purchases to its easing measures as soon as December, Reuters reported, citing several unidentified people. A spokesman for the central bank told Reuters “the Governing Council has taken no such decision.”
FTSE Outlook
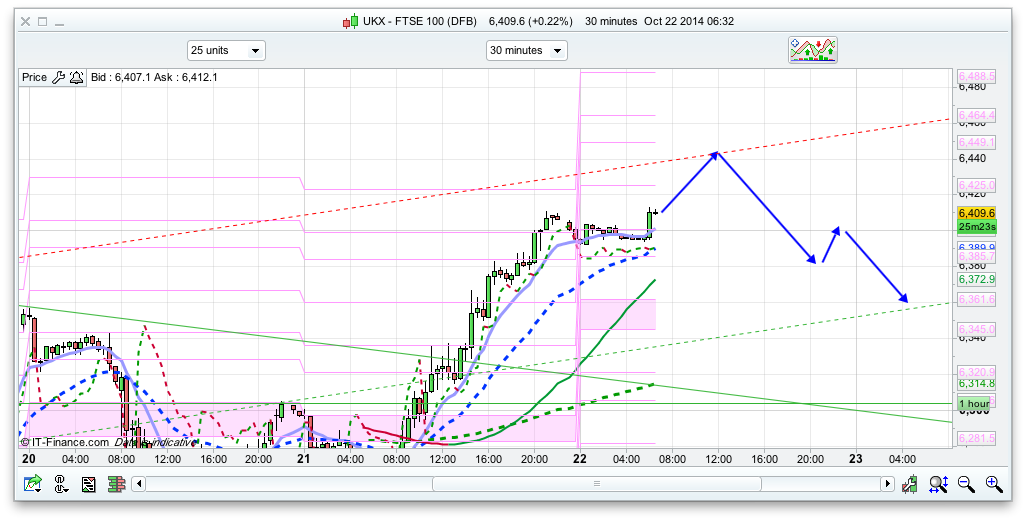
After such a strong rise as we had yesterday we are now well above the days pivot at 6325, though if we drop back that will be support now. For today, if the bulls can break 6408 in early trading, I expect us to rise to 6444 where we have the 25ema on the daily chart and likely to encounter some resistance. Its possible that the next down leg might start from there, though above that we have the top of the 20 day Raff at 6470. After what has been a pretty decent rise from 6070, the bears might reappear at one of these levels. They certainly backed off yesterday! Support wise, 6380 is initial support, and a move below that will signal that the bullishness is slowing down, probably allowing a drop to 6350, and then the pivot at 6325. The S&P and Dax are also not far off the tops of their 20 day Raff channels, 1954 and 9005 respectively. I think today might well be the reverse of yesterday – an initial rise and then a drop, as we also have the top of the 30 minute channel at 6444ish (depending on what time it hits).
Support so entry levels for a possible long
- 6380
- 6350
- 6325 daily pivot
- 6260
Resistance so entry levels for a possible short
- 6408
- 6444
- 6470
- 6570
FTSE going to pivot?
Morning Senu – I don’t think it knows where it’s going – but – it’s below the 30 MA (5 Min) – so trend to lowerside – use it as a stop
Thanks Hugh.
Why is it so dead in here? Everyone on the sidelines?
I don’t know what to do :- ?
I do, stayin short
System went long this a.m. @ 6346/09:35. Previously short from 6402/23:20. Long seems to be holding its own well.
that would have been a nice cheap long of the lo
scalping for me today short only
more up yet ?
The BTI turned down on 23 September and is still declining. We saw another strong bounce yesterday, this occurred after the FTSE became oversold on the 34-day BTI. Amongst all the indicators the 34-day BTI is the most reliable. When this indicator is oversold the FTSE will rally and it’s rallying right now. The only drawback is that it does not flash a signal very often and, as I explained yesterday, you need to use a wide stop loss with this indicator because the FTSE can still drop 100-200 pts while the indicator is oversold before the rally starts. Yesterday it was spot on, the FTSE rallied immediately. In the US the S&P broke a key resistance level which means the rally is not a fourth wave as previously thought, but a larger counter trend bounce. The rally will probably continue until next week. Some of last week’s jitters disappeared and fear was replaced by hope, hope that the ECB will intervene with more stimulus. In addition Apple’s results boosted the markets. I think whatever the ECB does, it will be a temporary patch. The market may rally but the bear market is well underway, any rally should be treated as a counter trend. Investor are slowly losing confidence in the ECB’s ability to boost the economy. If the Eurozone is flirting with deflation after so many interventions by the ECB, why would it work this time? Once the current bounce is over, stock markets should plunge to new lows.
What we are seeing is normal. When the stock market is oversold the bounce is often powerful. When the third wave extends the fourth wave can be large and exceed 38% of the third wave. When volatility is high moves extend beyond their normal limits, this is why I have said that in these conditions it is harder to make a profit, unless you don’t use a stop loss. You may be right on the direction of the market but if the stop loss is not wide enough, there is a good chance it will be hit. As you can see on the chart there is a wide range where wave iv (circle) can end between the 23% and 50%. Because the trend has turned up in the S&P and the rally will probably continue, wave iv (circle) in the FTSE is likely to end at the upper end of the range which is the 50% retracement. This level is 6474. Wave iv (circle) is an upward zigzag [(a),(b),(c)], wave (b) was the dip to 6229, wave (c) up is currently underway. The good thing is that from now on we know what to do. We are more likely to make money by going short the FTSE each time we see a large bounce. When the current one ends near 6480 the FTSE should decline to 5900 to complete wave v (circle).
thanks nelly
Welcome pal
Nelly, can you upload the chart pls?
Hello Javed
How are your targets for FTSE doing ?
Very interesting Nelly, I’m losing money everyday and a lot of the time I predict the correct way the market is going only to be taken out or close in fear, I’m getting very close to stopping this altogether, RC was very reliable when he was posting but now I don’t know what to do.
try a demo for a few days ,,and sit back and wait for the next big short
FTSE is flirting the 38.2 fibo from the lows, for the 1st time since the highs.
Once SPX clears this area 1940-1944…FTSE will resume.
Just to remind, that I had a buy signal on FTSE yesterday at 6354…1st time since Oct.1 (when I started to run the test)
Not: Now I have a stabilised system with reliable interpretation of the signals (when to take them or not) , on FTSE, DAX, SPX and DOW
Hi PMS, thanks for that, I went long @82 so hopefully your right, seems to be dead on here this week.
But careful that I do not use stops. Instead I reverse to short, when the sell signal appears.
looking at a short 6390 with a lock instead of stop and get back in higher
S&P 500, October 22nd
Today
Trend Down
Action Sell
Risk of trend reversal Low
Key Reversal levels
S&P 500 cash above 1964
S&P 500 December above 1957.5
The trend is likely to reverse when the risk of a trend
reversal is high. A breach of a key reversal level implies
a neutral position.
Forecast Indicators (15-min chart)
Elliott wave Bearish
Sentiment Bearish
MACD Bearish
DMI Bullish
RSI Bearish
M/A crossover Bullish
Target: 1920 (Future 1914)
Best risk/reward trade:
Sell in the range 1945-1964 for a move to 1920
Why?
Indicators are mostly bearish and the Elliott wave is
wave (b) down. The rally looks in five waves on the 15-
min chart therefore wave (a) is complete. The next
move is wave (b) down. The MACD has crossed below
the signal line (bearish) and the RSI is overbought
(above 30). This confirms the view that wave (a) is
complete.
Strong resistance between 1964 (pivot R2) and 1952
careful with that guy, who writes that letters.
He changes very drastically their analysis, from one day to another.
And he bases is analysis on Elliot wave, which is one of the most dubious view of markets. It interprets what you want to see
its only a view just like all the others NOT gospil
Can’t see the point of posting stuff like that on this board ..this site is called the FTSEDAYTRADER ..
are you for real s&p drives the world indices
check that gold spike down in 5min chart.
Yes Sam – check out the USD/CAD Spike at 13:30.
nelly, what is that lock?
sorry pal my talk its a hedge a trade in the other way if you are short say -8 take a long and lock it down till later gives you a tool to use its saved me 100s of times
I got it nelly.. 🙂
has your ma turned red and down yet?
Guys
– This board isn’t really achieving much this week.
– Copy and pasting things from other sites. I have got a computa as well !
– I’ve done this trade at this price an hour ago.(It’s helpful if the proposal could be posted 15 min before hand)
– Look at such and such instrument – this is a FTSE Board (&DAX – ‘cos Dutch’s contributions are good).
I know I haven’t posted very much but I’m also juggling a working life as well.
What is required to make it a constructive board
Trade ideas
explaining why & what time frame your using e.g.5 min / 10 min / 15 min / Daily / Weekly
Trade Entry – Tgt – Stop
Maybe the odd News thing if anyone is listening to Sqwark
KISS
By all means disagree with me – I won’t be phased
I disagree 🙂
No you are right but let’s not restrict (well this is up to you Nick as it’s your house) to technical charts only. There is room for macro economics, politics, experience etc?
Hi Dutch –
18 months ago, I upgraded to Girlfriend 1.0 from Drinking Mates 4.2, which I had used for years without any trouble. However, there are apparently conflicts between these two products and the only solution was to try and run Girlfriend 1.0 with the sound turned off.
To make matters worse, Girlfriend 1.0 is incompatible with several other applications, such as Lads Night Out 3.1, Going Flying 4.5, and Reduce Golf Handicap 6.9.
Successive versions of Girlfriend proved no better.
I tried a shareware program, Slapper 2.1, but it had many bugs and left a virus in my system, forcing me to shut down completely for several weeks.
Eventually, I tried to run Girlfriend 1.2 and Girlfriend 1.0 at the same time, only to discover that when these two systems detected each other they caused severe damage to my hardware.
I eventually upgraded to Fiance 1.0, only to discover that this product soon had to be upgraded further to Wife 1.0. While Wife 1.0 tends to use up all my available resources, it does come bundled with FreeSexPlus and Cleanhouse2008.
Shortly after this upgrade, however, I found that Wife 1.0 could be very unstable and costly to run. Any mistakes I made were automatically stored in Wife 1.0’s memory and could not be deleted. They then resurfaced months later when I had forgotten about them.
Wife 1.0 also has an automatic Diary, Explorer and E-mail filter, and can, without warning, launch TurboStrop and Multi-Whinge. These latter products have no Help files, and I have to try to guess what the problem is.
Additional problems are that Wife 1.0 needs updating regularly, requiring ShoeShop Browser for new attachments and Hairstyle Express which needs to be reinstalled every other week. Also, when Wife 1.0 attaches itself to my Saab 93 Convertible hard drive, it often crashes.
Wife 1..0 also comes with an irritating pop-up called MotherInLaw, which can’t be turned off.
Recently I’ve been tempted to install Mistress 2008, but there could be problems. A friend of mine has alerted me to the fact that if Wife 1.0 detects Mistress 2008, it tends to delete all of your Money files and possibly Pension 6.6 before uninstalling itself.
Help requested please
FTSE 5 Min
FTSE Challenging 30 MA
Will be looking to go Short if we get a close below 30 MA and then a break below 6381. Stop 6400
FTSE still not giving up for a pull back
Hi Senu
I’m warming more and more to the 30 MA on the 5 min. !
It’s as much as it’s direction more than anything – what I mean is – if it closes below it – it doesn’t necessarily mean “Sell” – it’s better to look at it’s trend of the 30 MA – either it’s – up – flat – down..
By the way – I think I mentioned that it’s easier for me to send stuff direct from my charts so if you email me I can send these to you.
statsuk@aol.com
just went short of DAX @40 as agree with most this looks like getting to levels of strong-ish resistance and logic would say the market needs to ease off and start downwards (well at least in europe). Just does not look like it though does it? Weird
Close below 30 MA – Short 8383.5 Tgt 6350 although it may change
good one. i too see this
has your ma turned red and down yet?
Still positive Libbo …
lols. this is turning back
Hugh, 30 ma holding
See how that 30 MA hasn’t changed direction – bugger 1 Long now to hedge out
is it still also blue Hugh?
16:25 pm – Yes
Short @ 87, 7 pt stop, target 70
gunfire outside canadian parliament might get the shorts going
FTSE bit rude today 😉
FTSE looks like heading for a close above 6400 🙁
Hugh, have you also taken long?
I did but closed out out b/e so I’m Short again
I’m getting a turn of the 30 MA at <6385
Senu – Flat again at 93
6072 – 6400 , what a run
sprint 🙂
good for you 🙂 still holding FTSE?
yup. Also, holding long in DAX and SNP. Gold short from yesterday.
😀 FTSE trying to clear the 6402-6403 resistance. Those red coats are a pain in the ass. After that we have the 6545 resistance
Did FTSE close above 6403 ? That would be a good sign…. but I doubt the red coats give this for free in a short time notice.
Now after the close the futures free for moving those tight boundaries.
Tomorrow another sell off at the open…. and so on…that’s life.
*6405
I’ve been out of it for a while. I don’t object to the reproduction of interesting stuff, but if one is not the author, the source ought always to be acknowledged! Latest signal is buy @ 6396/16:20 — 5 min. timeframe.
LoL
S&P500
Nelly – Thanks – I never realised.
Is it in London or the US ?-
I guess it’s similar to the FTSE .
nelly 007 says:
October 22, 2014 at 2:01 pm
are you for real s&p drives the world indices
dont be a smart ass
Looking at S&P’s better than any charts or technical analysis you could look at.
PMS
Not great at the mo obviously. Sittimg on a 200 odd point loss….not as bad as it was….and still up 600 points ytd so not bad. Still think the remaining months will be bullish and we could end the year at least around 6800.
Still maintain that next year is when we will see a correction although this correction has taken me, and most people I suggest, by surprise. Down perhaps 15% next year so perhaps below 6000.
Thanks JAved for your insight
Blame tesco?
Right on cue to weigh the FTSE down.
Might be consolidation after the sprint.
Long @20 (s2)