
Good morning. I hope you all had a good day yesterday which failed to break the Bianca channels. After the pre market rise to 6525 it was downhill most of the day with a pretty decent low at 6435. The Bianca channels are holding the bulls back for the moment, aided of course by the still lingering possibility of military intervention in Syria and eyes starting to look toward NFP on Friday. That said, the 10 Bianca is heading up a bit more now so maybe all is not lost for the bulls and we have had the 6393 level hold very well on two tests. Of course, a third test is likely to fail and we could be on for a 6080 level. A lot will depend on NFP on Friday and I think we will see quite a lot of volatility around this news this week. The Raff channels are still heading down with resistance around the 6525 and 6555 levels.
Asia Overnight from Bloomberg
Asian stocks fell, snapping the longest rally in three weeks, and emerging-market currencies weakened on concern the U.S. is moving closer to striking Syria. Australia’s dollar gained after the nation’s economic growth topped estimates, while crop prices declined.
The MSCI Asia Pacific Index dropped 0.2 percent as of 1:25 p.m. in Tokyo, falling for the first time in five days. Stock indexes in the Philippines and Indonesia sank 1.9 percent. Standard & Poor’s 500 Index (SPX) futures were little changed. South Korea’s won declined from a four-month high versus the dollar, while India’s rupee lost 0.6 percent. The Aussie climbed to a two-week high. Soybeans slid 0.9 percent.
U.S. House of Representatives Speaker John Boehner backed President Barack Obama’s call for action against Syria and leaders of the Senate’s foreign relations panel agreed on a proposal backing military strikes. Australia’s economy expanded 0.6 percent in the second quarter, data showed. Markit Economics will release its euro-area services report today while the Federal Reserve publishes the economic outlook survey known as the Beige Book. Data due Sept. 6 may show U.S. nonfarm payrolls increased 180,000 in August.
“Markets don’t like wars occurring and are concerned about the intervention that could potentially occur in Syria,” James Lindsay, who helps oversee about $21 billion as a fund manager in Auckland at Tyndall Investment Management Ltd., said by phone. “We’re taking a little bit of risk off the table.”
US
The S&P 500 pared gains and oil extended an advance yesterday after Speaker Boehner, an Ohio Republican, said that use of chemical weapons requires a response and only the U.S. has the capability to “warn others around the world that this type of behavior is not going to be tolerated.”
The Senate Foreign Relations Committee will vote on the draft resolution approving military action in Syria as soon as today, the panel’s Chairman Robert Menendez said.
Dax
Near term, further movement below 8150 has the potential of 8127 with secondary, if exceeded, at 8070 points which may prove to be something of an ultimate bottom in the medium term. If it opens up above 8223 I expect a day of gentle relaxation toward 8170.
Outlook
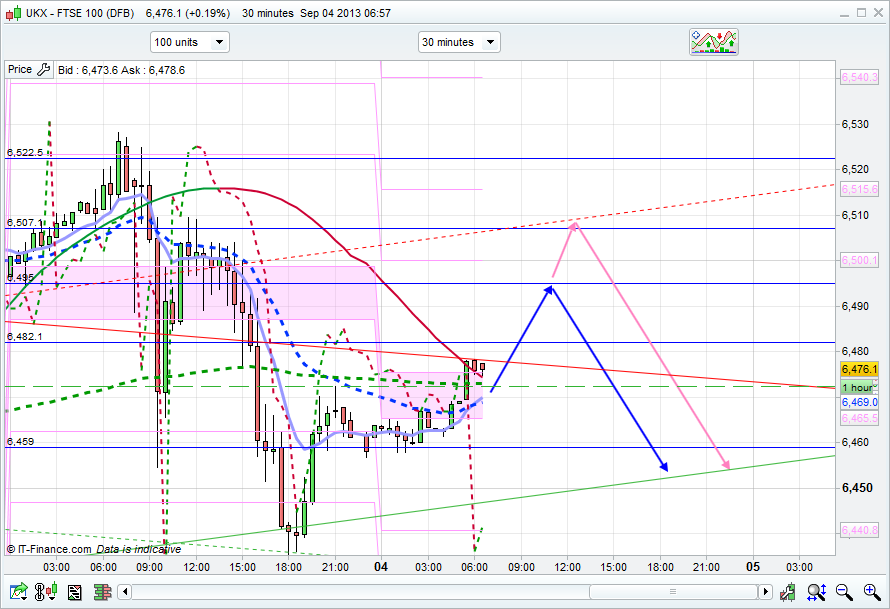
I have plotted the arrows for the rise to the 6495 area before more downside. The EMAs are ok for a little bit more upside but sentiment is still for downside, however (why is there always a however with trading?) the bulls certainly bought the dip yesterday. I have also plotted the possible pink arrows, which is a rise to test the top of that 30 minute channel. Based on my trade plan below as you can see I am still fairly bearish for the moment. To get me bullish in the short term the market needs to move and hold above 6495. Looking to the S&P, its hitting resistance at the 1644 area and support at 1627 which If broken could also be seeing a downside risk, possibly to sub 1600!
Yesterday had a gift on the Dow (gap up in a down trend) but on the first day of the month usually being bullish was not for me but filled all the same. Long the FTSE is not easy against a gap fill in the US. FTSE is still trading around its swing point a 6454, The weekly swing point is 6517.. No high or low ticks on the daily.
This mornings trade for me. Break of the 30min opening range and short at 455 which was confluence of yesterdays low and the daily 10sma. Sold half at 2R and letting half run.
I had a feeling that we would be around where we started the week by cob Thursday – prior to the main event – NFP.
Btw – not surprisngly the half way point between the key support 6338 and resistance 6532 is 6435 which is where we have been anumber of times. The NFPs will determine which one we will break, but with the Syria situation always at hand to put a dampner on things have to be bearish.
Personally think we will break 6338 by Friday and head towards 6220 by early next week.
Hope so, Javed. I was thinking here about your morning range again and I hope I get it right this time. On 30 min chart when it broke down below 6459 the close of that candle was 6450.8. Is that what you mean by the “morning range” between 6480-6459? And I suppose you entered on the following candle?
I had a couple of pick up trades for a tiny profit hence I missed the drop.
One for Jay methinks…….
Thanks.
486 to 446 on the cash, you can just look at the first 2 candles on a 15min chart. we just touched the bottom of the range now. if you look at the trade i usually take. Break of opening rande and first retrace to the 10sma on a 15min chart. you could have made 2 x risk today with that also. i like to trade the first setup so was already short. also i’m looking at the cash chart. not a spread chart with 24h.
Oh Gosh, Javed. I’ve just realized I asked jay a question then. Got totally mixed up!
I use cash chart, normally 10 min, 30 min, 1 min. 10 min is the main one for me. Basically trades after pull back is what we are doing here really, otherwise how would we know where it would go. If it pull backs so it has a potential to go to the same direction again. The problem is of course to get the better entry and come out on time. So I am trying to use other indicators to help me with that like trend lines, fibs, self plotted channels.
exactly.. and lets be honest. there is usually 2 good moves a day at most. the first move of the day and its pullback is the best. the most important levels are on the bigger time frames.
last months high low and close, last weeks high low and close then the daily. intraday i use the 15min. anything smaller than that and i struggle to got 2 x reward to risk. I have got DMA for futures but trying to scalp is just not my thing.
Any 1 with head better than mine ?? Is FTSE going down to 6393 ish ?? or has the marker worked some logic to keep it going up ??
My reply to Donald from previous. Levels i’m interested in. I think a trip down to the 200sma would be still a normal retrace. On the monthly we have june closing below may forming a temporary top. this makes 6020 as monthly support. In july it closed back above keeping me bullish. If we do close up on a weekly before taking out 380 then 380 becomes more important as support but i think we may visit the 200 first. if we can close above a weekly swing point then i will take a swing trade long but not before the weekly flag breaks to the upside.
i was long from 6429 to 6455 and made fair amount today but according to my charts its a great time to be short from 6455 or 6466, it will drop down to 6400 by 4.30
I am not so sure, the last 40min its been f….. mad!!
i see what you mean! this is bull!!!
If it goes this way we will end the day at 6500!
i am very positive this long pressure is a very short lived thing, we will see a colossal drop, all we need to do is be patient and have a great entry point to short!
Time to short, keep the wide stops.
ahwab i hope you have waited, seems the market will reach 6485 before a drop
Yes, I can see this to drop to 6400 by 4.30pm?!!…lol
Maybe a dip to 6468 or 6460 at most. However for that the Dow would have to go to 14890, S&P to 1646.
i meant 6440 lol 6400 is way to optimistic
You were totally wrong on that one!…lol,…we ended up close to my 6500 then yours even the revised one of 6440…
sod that!
The thing is that those morons over the pond live on a different planet to the rest of us!!….I just love to listen to the comedy show on CNBC or Bloomberg when they talk about stock and how cheep they are!!!….yes, I can see the average American running to the brokers to bay couple of Apple or Google just so they can get $20 pa in dividend…
NEW YORK–U.S. stocks edged higher Wednesday ahead of a Senate committee vote on U.S. action against Syria and key data that may influence Federal Reserve decision making.
The Dow Jones Industrial Average rose 54 points, or 0.3%, to 14888. The blue-chip index was weighed down by Microsoft Corp., which fell 2%.
The S&P 500-stock index added seven points, or 0.4%, to 1647 and the Nasdaq Composite Index gained 22 points, or 0.6%, to 3634.
The merchandise trade gap for July widened to $39.15 billion from a revised $34.54 billion in June, compared with expectations of $39 billion.
Still on tap, total vehicle sales from auto makers in August, released throughout the day, are seen rising slightly to 15.8 million. And the Federal Reserve’s “beige book” survey of regional economic activity is due out at 2 p.m. EDT.
Meanwhile, investors are looking ahead to the government’s jobs report on Friday, as the Federal Reserve has said the strength of the labor market is a key driver in its decision on when to start reducing monetary stimulus. Some investors believe the Fed could start tapering its bond purchases as early as this month.
Tony Dwyer, equity strategist at Canaccord Genuity, expects the market to remain in a holding pattern for now. “We’re in a vacuum of major news until Friday’s jobs report,” he said.
He believes the market has already priced in worries about Syria and the Fed, so would recommend buying stocks on any further weakness.
“The two issues of Syria and Fed tapering have provided an excellent entry point for investors,” Mr. Dwyer said. “We think bond yields have already reflected the bulk of Fed tapering.”
Does seem the DOW is building some strength…slowly grinding up……buy the dips come in whenever it comes near 14,800.
However is this just giving the market room to fall on Friday?
Javed – Did you write this? I love “We’re in a vacuum of major news until Friday’s jobs report.” Literally LOL and on the floor! And, “The two issues of Syria and Fed tapering have provided an excellent entry point for investors.” concurs with my suspicions/thinking.
In the case of the FTSE, the straight line trend through support points from 21 August has a positive gradient of c30 degrees. The ‘confirmed ups’ of Monday for the Dow, S&P 500 and FTSE are looking a wee bit more secure, but I shall wait to see what Friday brings … 🙂
All aboard to down train, dont jump out too early looking for 6430ish. That means you jack 🙂
Will my short on the Dow at 14925 get hit today? Worked well yesterday when it fell down to 14,780 (I moved my stop to 14,805 where it was closed). However it looks like for now it won’t push through so down to 14,880 initially.
On the FTSE no new trades added to my existing short position today. The short trade at 6530 down to 6440 worked well this week.
A tad early on the Dow today – should have been 14952. Anyway still confident we may see sub 14900 at some stage today. Would mean the FTSE falling close to 6460.
I got some short 6482.3. Now I think I may have done another mistake.
I have been short since 465, stops nearly hit, fingers crossed for a drop.
Stop hit….
Lost 15 points… Big boys making it rise fir fridays drop i guess. But this bullishness is completely uncalled for.
Took the day off today. 🙂 Just checking the close on my smartphone. What’s with the Dow up 120?
As you said yesterday…..hammering it one way to allow room for a drop maybe? An attack on Syria looks even more likely, data is good….so let’s have a fake rally……and watch it fall again…..hahah…..I hope so anyroad.
Yes I agree Javed. In the last few months the big moves happen BEFORE NFP is out (1-2 days before) and followed by a subsequent move AFTER NFP is out. So looks like more of the same again. So if DOW falls some 150 on Fri, is no biggy, given today’s rally…
Subsequent BIG move
i need to be a lot more patient when opening positions.. :((((((
Good evening for shorting ftse with dow on a high likley a good pull back
On fibs looking at a pullback to at least 14906 and possibly 14880. Good for at least 15 points on the FTSE.
No Jim of course I didn’t write it……it was that Tom Dywer dude…..whoever he is.
Syria priced in……well that took the Dow from above 15000 to below 14800 so is it still priced in? I’m not so sure.
I do agree the Dow is finding some support especially if it can hold above 14900 today.
Market breadth showing bullish divergence so i am holding long for the moment
Quite unexpected this is…well im off to bed will see how nfp turns out tomorrow
Done with this forum. Fed up of having peoples insights in my mind when I am trading. Between this forum and the traders daily market outlook I have realised that nobody knows anymore than I do what the market is going to do. Good luck everyone but I am trading what I see and not being influenced by others. Sure everyone will advise me to do my own research and I do, but I find these forums and blogs skew my thinking about. Had a good day staying long when everyone was calling for people to go short today. All the best and happy trading!
Ps. Mahmoud and Javed are always calling crazy trades against the trend. Do your own thing everyone!
Sorry to see you go Matt. All the best mate with your trading. Good luck 😉
Matt you’re doing the right thing trading what you see… The reason most traders lose is cos they trade what they think based on some deleugion that the market over the course of a day is going to follow their interpretation of the economy, world peace and especially whether this or that is priced in… Makes me lol…
Luckily managed to slip off my short on the opening. Fully recovered but because I had to take a brief long to recoup the losses. Well, that’s the price for putting wrong trades. I would be probably still in long trade from 6490.
I have to miss this push unfortunately. Heh, old mistakes creep in yesterday. I would never short above 200 MA after the channel break. But wished it was a push down to pivot first.
Gutted
closed long for +93pts, yum yum!
How do you get courage to take these trades? This long for example? Not many people spotted this long. I had a thought about and that’s it. How are you doing it? Is it control of emotions or general technical knowledge? If you don’t mind could you share?
it doesn’t always work out, but that’s just part of the game of percentages of wins/losses and reward:risk…
Basically, I analyse market breadth of FTSE using Mcclellean Oscillator and adv/decline lines, I then look for signals like divergence, then combine those signals with what I determine support/resistance usually on the daily/weekly charts. So yesterday there was a bullish divergence signal, admittedly not a strong one, basically there were more advancers than decliners compared to the ftse price action.
In terms of “courage”/”emotions” that’s just experience, you need a solid understanding of your “plan”. Jack ask yourself what your “plan” is?, why are you entering a trade? and when will you exit it?
Here is a suggestion, and it would be interesting to see your results:
For your next 10 trades, after your hit the button, “immediately” write down your reason for entering it in one sentence. Ditto, when you close that corresponding trade, write down why you exited it.
Good trading
So FTSE rallies some 75 points BEFORE ECB/BOE news and then gives it all up within the hour…;-) Lol….manipulated markets??…NEVER!! 😉 £20 loss taken after closing transactions on the way down, was a lot higher when I shorted at 6507 @7 pt, was over £250 loss. Would have been a profit of some £150 if closed at 6485. What an unexpected rise and subsequent drop!! If this is how the rest of the year is then I think I will need to monitor my blood pressure on an hourly basis as opposed to on a daily basis 🙂
Great advice AI. Great recent posts, Javed. Nice to see Ray and Jay back. Always interesting to read Jack Two’s daily trials and tribulations. Keep at it mate but watch those emotions-they’ll kill your trading! I’m trying to be more logical and methodical and avoiding my emotions. Have a Plan and stick to it. Best advice. As ever, thanks to Nick and the other posters that give good reasons for their trading setups. Good trading to all.
Thanks Tee 😉 Best of luck with trading.