
Good morning. Well that was rather more bearish than expected with he 6611 not even holding up much support. Wasn’t expecting a low of 6520 yesterday I admit. Chances are this is just a flushing exercise to take out as many bulls as possible before climbing again. If you compare this December action to last December there is quite a similarity, with the rally last year starting on 16th December and lasting into the New Year. Might well get a repeat this year. The S&P played the game anyway, with its dip and then bounce, but going a bit lower than the 25ema in the end which was the level I was watching. Still, it now has a decent tail on yesterdays candle so could be on for a rise now. The FTSE has held onto the gains after the dip to 6520 so we could see a bit of stabilisation after 2 trending down days.
Asia Overnight from Bloomberg
Asian stocks fell, with the regional index heading for its biggest two-day drop in a month, as oil erased yesterday’s gains and global currencies swung by the most in more than a year. Chinese shares rose even as inflation data that missed estimates raised growth concerns.
The MSCI Asia Pacific Index slid 1.1 percent by 3:16 p.m. in Tokyo, poised for its lowest close since Oct. 24 as Japan’s Topix gauge fell 2 percent, its biggest one-day drop in almost a month. The CSI 300 Index of shares in Shanghai and Shenzhen advanced 2.5 percent while the Hang Seng ChinaEnterprises Index rose 0.7 percent after tumbling 4.6 percent yesterday. The JPMorgan Global FX Volatility index increased to 9.5 percent, the highest since September 2013 as the yen headed for a third straight gain and Australia’s currency snapped a record losing streak. Oil decreased for the fourth time in five days.
Chinese producer prices slipped 2.7 percent in November from a year before, a 33rd straight decrease, while consumer inflation slowed to 1.4 percent, the slowest since 2009, reports today showed. A move to tighten short-term lending rules in China sparked a rout in global equities yesterday, fanning concern over the outlook for Asia’s largest economy. The prospect of an election in Greece fueled speculation opponents of the European Union’s bailout terms may gain more power.
“Caution is probably at the top of the agenda,” Tim Schroeders, a portfolio manager who helps oversee $1 billion in equities at Pengana Capital Ltd. in Melbourne, said by phone. “As some investors change asset allocations, we’ll see some extreme moves over the next couple of weeks.”
Japan Election
The Topix index declined for a second day, closing at its lowest since Nov. 27. The benchmark has rallied 20 percent from an Oct. 17 low. Toyota Motor Corp., the world’s No. 1 carmaker by market value, slid 3 percent as the index’s biggest drag while Nomura Holdings Inc., the nation’s largest brokerage, dropped 1.5 percent.
Japanese voters head to the ballot box Dec. 14, after Prime Minister Shinzo Abe called a snap election to seek validation for his program of economic reform. Data this week showed Japan’s recession is deeper than first thought.
The Shanghai Composite Index (SHCOMP) added 2 percent after plunging 5.4 percent yesterday from a 3 1/2-year high. The Hang Seng China Enterprises Index (HSCEI), which tracks mainland Chinese stocks listed in Hong Kong, declined the most in three years yesterday. Hong Kong’s Hang Seng Index increased 0.3 percent today.
“China has entered into a rapid dis-inflation process, and faces the risk of deflation,” said Liu Li-Gang, the chief Greater China economist at Australia & New Zealand Banking Group Ltd. in Hong Kong. “As the PBOC has exhausted its newly invented and ineffective policy tools, we believe the next move will have to be a reserve ratio requirement cut in order to regain policy effectiveness and credibility.”
Bond Rules
The cost of one-year swaps, the fixed payment to receive the floating seven-day repurchase rate, fell five basis points to 3.30 percent, after climbing as much as seven basis points. The yuan swung to a 0.2 percent gain in offshore trading after two days of losses.
China’s clearing agency said Dec. 8 that local bonds rated lower than the highest AAA grade are too risky to be used as collateral for short-term loans. That means about half of the outstanding 1 trillion yuan ($162 billion) of securities sold by local government financing vehicles, or LGFVs, in the exchange market can no longer be pledged to raise funds, according to Morgan Stanley.
Gross domestic product growth in China will decline gradually, Moody’s Investors Service said in a report today. Credit quality will, however, be supported because policy makers will manage economic weakness.
Australia’s currency climbed 0.3 percent to 83.20 U.S. cents after falling as much as 0.3 percent and trading near a four-year low. The Aussie yesterday capped a ninth straight decline, the longest losing streak since it was floated in 1983, according to data compiled by Bloomberg. China is the No. 1 trading partner for the resource-exporting nation.
Crude Retreats
The Bloomberg Dollar Spot Index retreated 0.1 percent to 1,114.26, a third consecutive decline after closing at its highest level since 2009 Dec. 5. The greenback was weaker against all major peers.
Japan’s currency jumped 0.4 percent to 119.26 per dollar after advancing versus all but one of its 31 major peers yesterday. The yen is up 2.1 percent this week, poised for its biggest three-day gain since August 2013. The world’s worst-performing major currency versus the U.S. dollar this half climbed as much as 2.3 percent yesterday.
West Texas Intermediate crude slid 0.9 percent to $63.24 a barrel, erasing yesterday’s 1.2 percent gain. Brent crude slipped 0.8 percent to $66.33. Yesterday’s rally boosted U.S. shares of smaller energy companies.
The Russell 2000 Index (RTY) of smaller companies rose 1.8 percent as energy stocks jumped 6.1 percent, leading gains among nine industry groups and paring yesterday’s 7.3 percent tumble. The Nasdaq 100 Index added 0.4 percent, while the Dow Jones Industrial Average slipped 0.3 percent. The S&P 500 was down less than 0.1 percent to close at 2,059.82.
FTSE Outlook
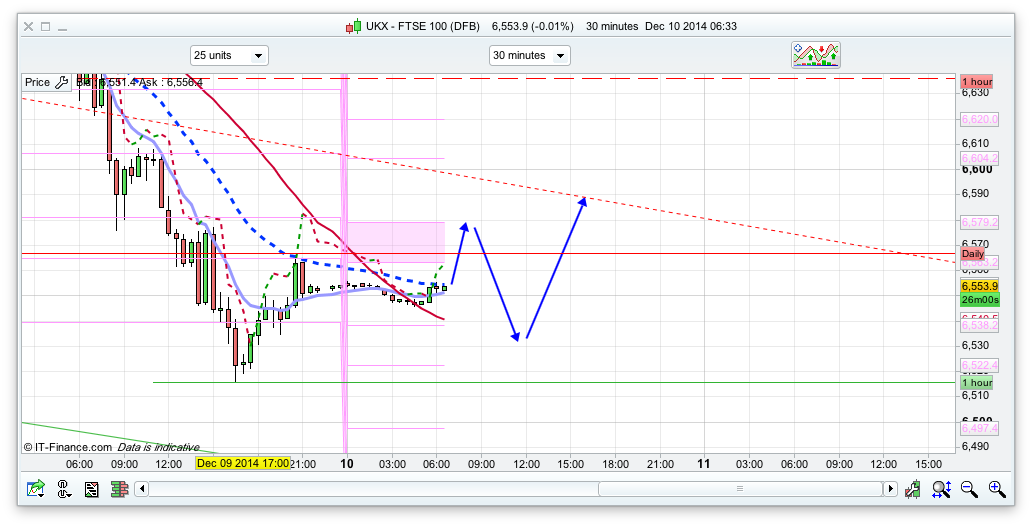
Todays pivot is initial resistance at 6576 so I have put in a down leg from here after an initial rise. If the bulls manage to break that pivot level then we should reach 6633, with 6685 the next level above that. Having broken below the Bianca channels yesterday we should rise back within them today/tomorrow. The S&P put in its dip as expected (albeit a bit lower) and have climbed back, which if that that climb continues will pull the FTSE up too. The bottom of the Raffs today are at 6510, both the 10 and 20 day, and I expect that area to hold if we dip that low, but the 10 day Bianca is 6530 – a level more likely to hold for today. So, those are the main levels – 6576 and 6530 to watch today. Can trade breakouts either way if they break similar to yesterday with 6611 breaking and just going short. I do think once enough longs have been stopped out that we will climb.
Morning, how is everyone doing?
No trades at all today so far! A bit clueless, FTSE mostly sold last few days compared to DAX & DOW and still sitting outside lower Bollinger on daily chart, and still bearish, would like to see a move above 6580 first before buying for Santa rally, to see if we can then later target higher next week, until then vary cautious, as longs stopped out yesterday.
RC your signals last week, has met all of yours T’s, and “what a signal” – perfect spot on, even though market was bullish last week.
RC do you have any new signals this week? Would be much appreciated, as need it 🙁
I’m still long DOW from 17947… Hoping for a big boost today to get me out of the mess. Still, it’s better than at one point yesterday – 17629.
Does anyone think good idea to short DOW today? any signals, ie after yesterdays recovery will it test the lows of yesterday? I am thinking of adding a small short with stop around 17850.
Trying small short DOW@17775
Any one interested in my collection of charting books please email me at marcopolotrader66@gmail.com
I am looking for £40 for them all and they are all in mint condition.
JAPANESE CANDLESTICK CHARTING TECHNIQUES SECOND EDITION – STEVE NISON
TECHNICAL ANALYSIS OF THE FINANCIAL MARKETS – JOHN J MURPHY
TECHNICAL ANALYSIS EXPLAINED FOURTH EDITION – PRING
INVESTORS GUIDE TO CHARTING 2ND EDITION – ALISTAIR BLAIR
THE FINACIAL SPREAD BETTING HANDBOOK – MALCOLM PRYOR
NAKED TRADERS GUIDE TO SPREAD BETTING – ROBBIE BURNS
BETS AND THE CITY – SALLY NICOLL
A GIFT TO MY CHILDREN – JIM ROGERS
Good offer, marco. Try ebay. I just sold The Candlestick Course Steve Nison for £20, took me 2 month though but I did it. Pleased to recover some losses this way. 🙂
Maybe I should buy everything from you and start selling on ebay separately, that’s the idea. however joking.
Hi Jack
You are right about selling individually on ebay, just cant be bothered to sell individually. Still trading just found posting influenced my trades. You okay? do you special deal £35
No, I just don’t have time, checked each book on ebay though. But cannot invest my time on it. Sorry.
DOW short looking good 🙂
Will it continue drag FTSE down, seems a continue of yesterday.
Any dividends today?
Divi today is 1.5
Thanks
long term long @30.
good trade (if u really are going to hold long term)
long time no hear, hashmash. How u been?
In terms of long-term, topped up in my SIPP today, so that’s physical purchase, no stops no stress with div…for very long-term
For trading still waiting for 5680 to cross, before buying longs…
Closed DOW short@722 🙂
good trade mali 🙂
As expected DOW taking all down today…slide continues
Long @ 22
I doubt DOW can claw back losses like yesterday, so be aware and careful
thanks. i am out now
i still feel dow to close in green 😉
I think that’s the market plan, get all longs closed out 🙁
Hence have to wait till support found and moved above pivot, that’s not happening today.
looks like double bottom in dow..
Say that again, baby.
This is seriously getting on my nerves. Never see falling markets like this when I am short.
With no comments on signals, I guess no new Buy signals produced yet, so just have to wait it out, patience needed.
Am short all the way to 4000…!
She is going over guys
Not this month, may be next year 🙂
I was wondering more short term? Signals like days and weeks…only
Sam she topped out at 6877 on 4th sep AIMHO next stop 4000 before reversal and break out up through 7000
ECB and banks speak tomorrow, hope Draghi has more on QE in Jan14
Sorry meant Jan15
FTSE 30 mins. — Last signal: Sell 6547/05:30. Judge negative momentum building. FTSE 4 hrs. — Now oversold (RSI), but further downside likely ⇒ 6400-6450.
http://i1348.photobucket.com/albums/p736/jmca01/FTSE100DFB_zps9e45300d.png
Ravi you were spot on with 6500 before Santa Rally, but at this rate I wonder if Santa scared now 🙁
I felt 6450 Mali. Not complaining if Ravi’s right though!
I probably only saw 6500 as I’m looking out for overall monthly swings rather than hourly changes, it held up well that the markets had to drop somewhat, but no idea when to put the long position in yet. I’m waiting till next Monday.
Another day of “fantastic” arrows from Nick. Don’t want to intrude, but second day in a row wrong arrows and NO prediction of short rally. Why not? What’s the point of bouncing of somewhere?
Bouncing off somewhere is very useful. It’s called trading reversals and can be (and is) a successful way of winning points. Maybe the commentary from Nick is not as useful from outside the service – I dunno. It certainly seems profitable on the inside.
Good luck
Bouncing is useful when it bounces, and I got the idea that sometimes it bounces of levels, that’s why they are levels. But I don’t think reaching the level is the signal to take a trade, you need to see how it reacts with it first before taking any kind of trend.
Like today, on Dow you could try longs all day long and you would fail every single time, not matter how many levels the price has gone through.
Senu, thanks for your advice yesterday. I should stick to one index. I’m torn between Dow and Dax atm.
spx comfortably broke through yesterday’s low, expecting 2000 to be tested this week.
Jack 2 why are you always moaning about Nicks arrow? Do you pay for Nicks service? If no then you be grateful that you can even read what Nicks prediction are for the day and also showing where resistance & support are… I do believe Jack that trading is not you and that you are beyond help.
Oh I am grateful, I will stop reading then. Maybe this will help.