
Good morning. Well its a pretty bearish open, with the FTSE hitting a low of 6196 overnight though has bounced back a little bit. The sell off has continued for all the reasons you have read about – China, slowing global growth, kicking off a bit between North and South Korea and so on. The FTSE has now entered correction territory, closing 10% down on its most recent high at 7100. Today is also option expiry day (OpEx) so expect some sharpish moves around 10:10 this morning as the various futures contracts roll over. The Greek PM has also resigned yesterday, after winning on a wave of no to austerity, thats not really tenable anymore. As a slight aside, when its all doom and gloom and the news headlines are reporting how bad it is, usually means there will be a bounce coming.
US & Asia Overnight from Bloomberg
Asian stocks fell, with the regional benchmark index heading for its biggest weekly drop in three years, after U.S. shares succumbed to a snowballing selloff spurred by fears about the global economy.
The MSCI Asia-Pacific Index slipped 1.9 percent to 131.65 as of 10:02 a.m. in Hong Kong, heading for a 4.8 percent drop this week. The Standard & Poor’s 500 Index tumbled the most in 18 months on Thursday, while a gauge of global equities dropped to its lowest level since January. As the Federal Reserve inches closer toward raising U.S. interest rates for the first time since 2006, anxiety over developing markets is increasing, with China’s surprise yuan devaluation last week triggering similar moves elsewhere in Asia.
“The overnight weakness in global markets is making people nervous,” Angus Gluskie, managing director at White Funds Management Pty in Sydney, who oversees $550 million, said by phone. “The biggest concern among investors right now is the market volatility in China that shows investors are increasingly concerned about the health of the Chinese economy and how that might impact the rest of the world.”
A report today showed a private gauge of Chinese manufacturingunexpectedly fell to the lowest level in more than six years, suggesting the world’s second-largest economy will need further policy support to stem a deepening slowdown. Concern that demand is weakening has driven a commodities rout that’s erased $2 trillion from the value of mining and oil companies since the middle of last year.
Regional Gauges
China’s Shanghai Composite Index slipped 1.1 percent, with the gauge heading the its first weekly drop in three weeks. The Hang Seng China Enterprises Index of mainland companies traded in Hong Kong slumped 2.2 percent.
Hong Kong’s Hang Seng Index slipped 1.8 percent, extending losses from its April high to 21 percent, as declines in mainland equities and the devaluation of the yuan erode support for the city’s shares. The benchmark gauge will be in what traders consider a bear market if it closes at this level.
Chinese stocks fell this week after the securities regulator indicated a week ago that the state will reduce buying and data showed the richest traders were cashing out.
South Korea’s Kospi index fell 1.5 percent. Japan’s Topix index slumped 2.4 percent. Australia’s S&P/ASX 200 Index slid 1 percent. New Zealand’s NZX 50 Index was little changed. Taiwan’s Taiex index slipped 1.7 percent and Singapore’s Straits Times Index sank 1.9 percent.
E-mini futures on the Standard & Poor’s 500 Index slid 0.4 percent. The underlying measure sank 2.1 percent on Thursday, falling out of a 70-point trading range that had held for most of the year.
‘Asia Epicenter’
“U.S. markets have held up well of late, being viewed as somewhat of a safe haven,” Chris Weston, chief market strategist in Melbourne at IG Ltd., said by e-mail. “This view seems to have deteriorated somewhat with the S&P 500 closing below its multi-month trading range. If we do see something much more pronounced in global markets, the epicenter is Asian emerging markets.”
Greek Prime Minister Alexis Tsipras announced he will step down with an eye to snap elections, a move the embattled leader will likely use to shut out dissenters and return to power with a more manageable coalition.
“Greece is a non-issue since a deal with creditors has been done,” White Funds’ Gluskie said. “He is trying to get a bigger mandate of support. If he gets the mandate, he would be in a better position in handling the Greek parliament.” [Bloomberg Ref]
FTSE Outlook
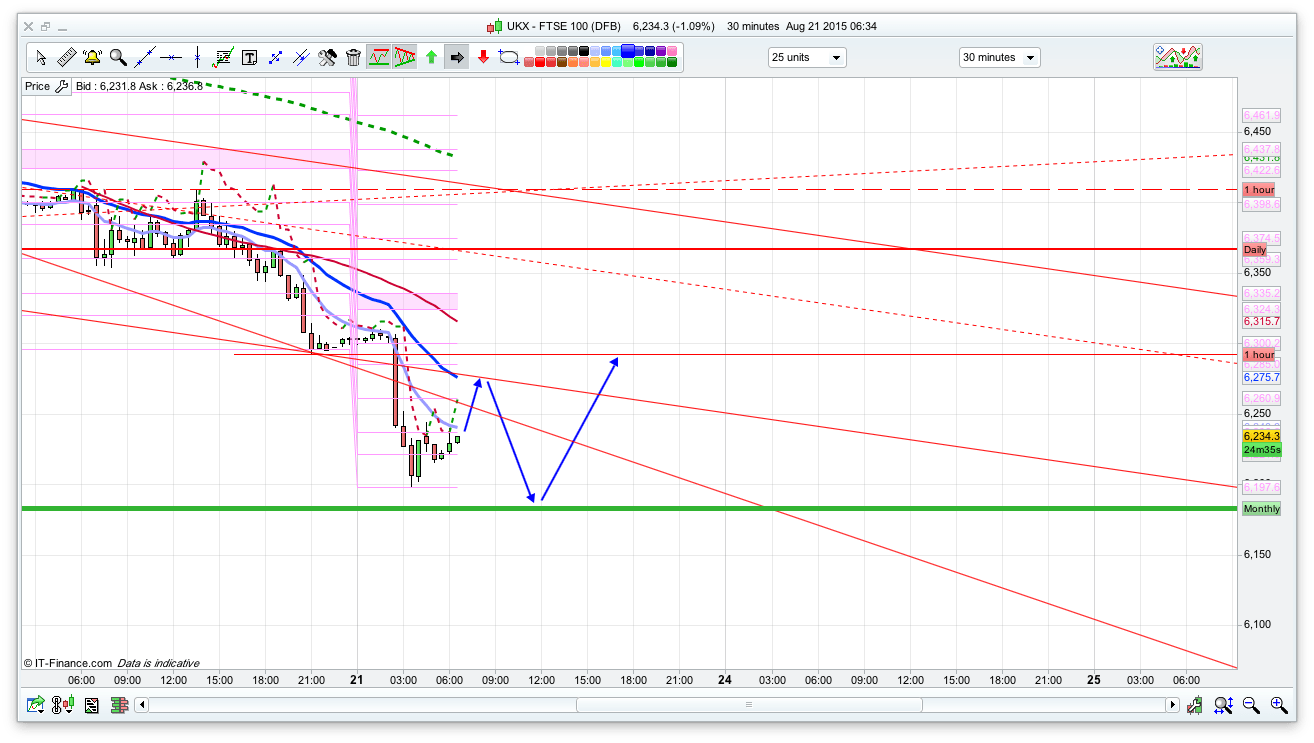
Its a bit tricky to know what it will do today. Its pretty bearish as I write this, and its OpEx Frday, so may just rise back up from the open. When everyones fearful, thats the time to buy as Buffet says. Certainly its usually the case when the FTSE sell off makes the headline news on the BBC the low isn’t far away. I have gone for an initial rise to the 6275 area then another dip to possibly test the overnight lows and we do have a decent PRT support line there as well. The 10 minute chart and the moving averages will be the one to watch I think as that should give an early idea of what prices are going to do. If the bulls do fight back and manage to break the 6275 resistance then the daily pivot at 6335 looks likely, and is likely to see some bears short from there. If we are on the cusp of a global slowdown (and some of this maybe just manipulation to keep rates low, play the game remember!) then the chance of rate rises next month is probably reduced. Generally I feel fairly positive and don’t think the financial markets are going to continue falling next week, and am watching the news flow as something positive will suddenly appear and then there will be a rush of more positive news.
whats everyone’s prediction for the day?
Personally, i think that overnight selloff was a bottom.
it seems to be holding at this initial rise, but I wonder if the dow will panic again today, and wait to buy back on Monday. I’m probably wrong as always, but after such a panic wouldn’t they just move to cash and buy back next Monday?
Morning, that was fun last night lol.
Anyone up at 4 to buy at 6198?
Been shorting into this expected rally with mixed results this morning. 6340 and 10400 seem to be far enough for the moment, but nothing broke until lower lows.
Hey Nick, love the bull reasoning
“am watching the news flow as something positive will suddenly appear”
and if it don’t, what next, Divine Intervention?
🙂
Little cracks starting to appear already, a move below 6315 and 10350 could accelerate.
Happy sitting short with stop at 45 for the time being.
I’m a little surprised how well its holding at the moment. 45 was a nice entry.
sorry misread in at 42
and out for 17
You and me both mate 🙂
Stay tight, I think 45 only has a finite resistance life today.
Don’t forget it’s opex at 10.10-10.20. spikey spikey time
yes, ZZ, hopefully that was it.
ftse had its opex suppressors on 🙂 Oh well now it can continue its grind up.
Short more at 43, moved stop to 52 on all
took half profit at 26
and rest out at 21, looking for a bounce to reshort
A small short back on at 35, 10 either way.
and out at 18, wtf happened there?
News often seems to follow the curve tmfp! 😉
Morning guys,
Sitting with a 6275 & 6320 short, not a very wise more, think I was listening too much to Bloomberg, what’s your take on it tmfp
Morning folks. Short ftse at 340. 😉
Morning All,
Much of it’s been said above …
Good call icarus..
Pete …
6275 and 6320 Short.
Always easier in hindsight I know but …
6275 – Fear trade..Close Last night 6317 – Open call 6273
6320 – Nothing wrong with that entry – Stops ?
What to do ?
Don’t let it run away with you.
If it breaks 6345 open a new trade Long ….
Close the Long off at an opportune moment and run your shorts again.
If your using IG IT Finance charts get a Renko up – 1 min/5min/10min – 2 point – it makes it alot easier to see the immediate range – then fine tune it looking at a tick chart or 1 minute.
Hi Hugh,
I hedged part of my shorts @6340, I’m hoping that it will drop enough for me to get out of shorts but if not the hedge will reduce the amount I’m lossing, not ideal but I’m in it now so have to try to get out, what do you think is going to happen its looking fairly bullish,
Tks a lot for all your help
Tmfp, what’s ur reckoning on another us sell-off this afternoon, or is it buy-back today. I know everyone’s saying china will defend 3500, but are they going to hold long positions over the weekend?
I don’t have a view really milka, see what happens when we get there.
FTSE 10mins — Got a sell signal right now, but expect it to be short-lived; price growth likely to stay positive I think. Certainly got a 4 am local min on this timeframe and Hull_200 on the rebound.
Morning All,
After the disappointment of Dax long stopping out for a little profit on tuesday, just decided to take a couple of days off the market and proved to be a good thing. Most important didn’t lose any money.
Looking at the charts, I think on the Dax it might get to 10480-500 before more downside next week.
tmfp, your shorts would have looked 🙂
Don’t mention the S word RJ 🙁
£30k in a week…………..
Is that what you could have made on your S ??
Ah well .. atleast your sleeping has been frustratingly peaceful. LoL 🙂
No, at 4 am this morning I could have made £42,600.
I took £11,270, 4 days too early.
CAN WE PLEASE CHANGE THE SUBJECT.
Morning All,
Much of it’s been said above …
Good call icarus..
Pete …
6275 and 6320 Short.
Always easier in hindsight I know but …
6275 – Fear trade..Close Last night 6317 – Open call 6273
6320 – Nothing wrong with that entry – Stops ?
What to do ?
Don’t let it run away with you.
If it breaks 6345 open a new trade Long ….
Close the Long off at an opportune moment and run your shorts again.
If your using IG IT Finance charts get a Renko up – 1 min/5min/10min – 2 point – it makes it alot easier to see the immediate range – then fine tune it looking at a tick chart or 1 minute.
Sorry Hugh,
I work of 1hr, 5min, 3min & 1min, I use IG stanard charts but I don’t know what Renko is
If you can help, it would be great but only when you get a chance, sitting here now with my hedge long & my 6320 shorts with stop @b/e, so gods know what will happen now, probably shoot up stop me out & then drop, now that would be nasty
Added again on retest of 40 and now out at 25.
away in meetings most day so will dip in and out
tmfp
be a little bit careful with your shorting
looks like it wants to go to 6358/60
Think we’re going to be ranging this morning – 6316 – 6344
Off out till later, have fun guys.
Hi Hugh,
I hedged part of my shorts @6340, I’m hoping that it will drop enough for me to get out of shorts but if not the hedge will reduce the amount I’m lossing, not ideal but I’m in it now so have to try to get out, what do you think is going to happen its looking fairly bullish,
Tks a lot for all your help
What happening now?
Pete
I’ll try to post later….
In brief though…
You need to look at your patterns…
What chart platform are you using ?
( I only mention it as if you look at a tick chart 6344.7 was the highest tick)
Did you get your Renko’s up..?
Tried to draw a little diagram for you but photobucket doesn’t seem to be working for me at the moment….
Hi RJ, just think we were getting excited over the drop on tuesday on the DAX and now look where we are. I too was disappointed and thought it looked like a good entry. Oh well.
gotta keep your chin up in this game.
Hi Coombsy,
Yes, I was looking for a bounce from that area to 11400 before further drops. I was biased in my thinking that Dax was going to go up so gave myself a couple of days off to clear my head.
With that bias, I would have lost money with that fall.
Did you have any position ?
yes i did just a few small trades, but have got to admit i was a bit of a falling knife guy, everytime i looked at the chart my brain went to auto and told me its the bottom so made a few long trades. even though i did know that the overall trend was down down and more down. its the saying the trend is your friend.
Just replied to Nick for yesterday’s post. Please keep up. And GL all.
TRSI Trio (L) 6286
Contra Trend Trade – tight stops & I mean tight !
Hugh, can I ask what you mean by trio, I guess it’s three indicators showing oversold? Am I right?
1 Min Chart – RSI 6 (20/80) RSI 17 30/70 RSI 31 30/70.
Yes – As you mentioned – All 3 must be at these levels for a trade.
Because of the time frame these are small gain trades – maybe 10-15 points .
Like all indicators – never always perfect …
What does changing the RSI setting do? Does it alter its sensitivity over different time frames. Like an RSI 6 is ideal for shorter time frames 1 to 10mins and RSI 31 for 4 hr to 1 day. ?
You run all 6 17 31 on a 1 min chart – they all have to align at the levels mentioned for a valid signal.
Range 6283 – 6303
Arh I see, thanks. Do you use other indicators or keep it simple? I have been trying to use stochastic and a MACD. Mating up the three together. But often only get one or two signals, by the time the three signal align I find I missed the move.
Hugh, would you mind posting about your triple confirm criteria? Is that the rsi trio thing as well
Coombsy, I used to have that problem as well. So I moved to 3 indicators. Macd, rsi and stochs.
You will Get better and more signals when atleast two of these align
You could try the same indicator with different settings….
These are oscillators – contra trend trades – a casual glance and they’re all pretty much the same…
When there’s a trend – as we’re in at the moment – you’ll get very few indicators telling you to go short – hence range pattern trading is possibly better at the moment.
Yes that’s what I’m referring to when I say “RSI Trio”.
You can set it up on IG to email you.
1 Min Chart – RSI 6 (20/80) RSI 17 30/70 RSI 31 30/70.
Yes – All 3 must be at these levels for a trade.
Because of the time frame these are small gain trades – maybe 10-15 points .
Like all indicators – never always perfect …
news on Reuters – citibanks proprietary system has signalled a buy so 90% chance s of a 5% upmove in the next 20 days.
New lows expected then before a bounce up? 🙂
Thanks Hugh!
Tech analysis short and medium term is a bit clouded by the out of hours data: How much weight do you give to a FTSE low of 6196 at 4 am? No liquidity and defensive pricing make that of pretty dubious relevance: but it did happen, 6200 is the low, tallying with December.
If one goes from the DOW close last night straight to 0700 for a valid premarket this morning, I think it gives a clearer picture and changes things, including rsi readings, quite radically.
For example the IG charted hourly 10 RSI is ~43, but the cash hours FTSE version is around 18.
The long and short of it is I think we are very oversold around here despite the illusion of being 70+ off the lows, so if there is some early hangover liquidation on the DOW it could prove to be cheap later on, certainly a good time to think about closing shorts, or very light longs from here down every 10 points to 200.
I just took a small marker long @ 77 in case a sell off doesn’t materialise.
Keep it light and tight.
🙂
This theory, if you are prepared to long, would probably work better applied to the DOW not the FTSE, little longs at 50 pt increments from here down.
With a budget based on a revisit to 17050/100 as a target.
I still think this could be an earner for someone prepared to long over the weekend, but I’ve changed my mind about doing that myself, so just come out at 72 b/e on the two ftse longs 77/67 (just missed 57 by .2) and at 16880 on the two DOW longs, a nice little turn on buys at 16840 and 16790.
Off for the weekend, cheers chaps!
long 67
TMFP, do you mind me asking what picture did the out of market give you compared to the opening hours?
Also, when you say 70 off the lows do you mean above the out of hours low or 70 below during hours low from yesterday?
See for yourself milka, just get a site like investing.com for cash hours charts and compare to an index’s 24/7 version like IG.
Well, as you said tmfp, the technicals are screwed atm, so I have done what I usually do:-) gone long small size at 16795 with a view to hold it long term and add every 100-150 points down.
I have a support coming up at 750 so hoping I will close this position for +300 :-))
do u have a short dow position as well which u want to close at 750?
Hi tmfp,
Closed all shorts, left now with my hedge @6340 which I opened this morning, not great but I think I’ll let it hopefully come back, I was planning to close it aswell & take the hit but I’ll see what happens
So Pete – Stops in 6254 on that Long ? (or New Position Short & then Stops in at 6282 ) – get the feel for it..
Range 6255 – 6282
That means – Sell as close to 6282 – light and tight as tmpf – a masterful catchphrase !
Only when we get sellers wrong footed is the trend likely to change.
Yea tks guys, are you both trading long
Sorry trading a long time:)
Pete – There’s only one thing wrong with my suggestion and it is that your selling at the lows. (e.g going short at 6254 – which is kind of asking for trouble hence why you need an initial goodish entry…
Yea I know what your saying, but if it does go below 54 I’ll treat it as a hedge on my long I foolishly opened this morn @6340 to hedge my shorts at the time, messy I know but just trying to cover myself, done ok on my shorts I closed @65 so its not too bad
All due respect Pete, but you’re in danger of using this “hedging” as a way to deny losses from poor entries. You are now hedging a hedge….
If you make a mistake, sort it and start again, it’s not the end of the world, don’t hide it and pretend that it will come good.
All the best.
If you’ve hedged out – I’m thinking – stick with it – so if we go to 6190.
Then take your profits. That is a low entry that should yield some results.
Pete, unless you can handle the pressure day and night I would strongly recommend a closure. I’ve burnt out once with this hedging and averaging business and its not pretty. If the trade doesn’t work, close it!!find another one
Just logged back into IG and hey presto!! Probably the first time I got the long entry so accurate:-) right at the lows!!!
Believe me it was just a random entry:-)
DOW
Shorted at 780
Looking to close at 690
Tight stop at 800
That worked quite well, closed at 690.
Long again at 685, 15 point stop, looking for a bounce to 720
Stop moved to b/e
what was your criteria for this trade whoopsie?
I’m using Hugh’s RSI Trio system to give me an indication (which is working very nicely thank you Hugh)
although as I type I missed the 720 by 2 points and got closed out at b/e, typical haha
Hi just wondering what did you see on your charts and at what time for this trade. I am trying to set this up myself but I don’t see any entries so I think I am messing it up
Dow 15mins — Price just fell through Hull_200, which already has a strongly negative gradient. 🙁
So I should close my 6340 long, I’m now also short the same amout per pip, my thinking was it would come back to 6340 in the next day or two, I worked with stops before and generally the market came back and with the way it had dropped this week I thought it would have to bounce sometime, I know its messy so I’ve closed my 6340 long & took the hit, I’m still up for the day anyway
Rejected 6255
Narrower Range 6234 – 6256
….& now that’s been challenged ..
Fibbed out and I’ve got 6190 as 0% (using 6267 as 50%)
RSI Trio (L) 6215 – If anyone’s brave enough
There’s a strong undertow!
Dax
Long at 10171
Stop at 10151
Target at 10230
Whats your basis / reason?
None it seems, looked positive for a few minutes, then caught up on me.
I’m steering clear of the DAX for a little bit, just can’t seem to call it atm. Only market I’m red for the month… ahh well.
busted all time frame charts
now only weekly left bottom at 6123 then 6070
certainly do not want to go to monthly charts
Sold at 15 will Close at days lows or lower
Closed 89
recovered losses
Wonder why ig don’t let opening positions as force open by default
Tks guys for your advise, glad I got rid of that long
I think Mr. Whoopie just tried a divergence trade which went wrong. If that’s the case, it was not divergence
The DAX certainly went wrong i’ll take that on the chin.
DOW only went partly wrong, missed my limit by 2 points and went to get coffee at the wrong moment…. you win some etc
Does anybody know where the next possible stop is for this drop
Anyone brave enough to go long on the FTSE at this stage then?
Gone Long 6182 PRT Line – Stop 6173
RSI Trio Again …
Out almost before you were in on that one Hugh, it’s a strange game sometimes isn’t it?
Short lived !!
If 60 holds we are going to 700 and back on dow.
if I knew pete, I would liquidate all my assets and go for one short or one long trade 🙂
Ha ha, yea if we knew everything we’d be too smart, looks like it has found the floor, stop @6200 so that will be me out, happy enough with my day
i think this has taught me a good lesson which i am not going to forget easily
have conviction and just trade it
ignore all doubts which inevitably the market throws at you
i refer to a strong belief both fundamental and technical that tmfp presented
3 – 4 weeks back about the market reaching 6400 & under
i felt the same, then doubts crept in and lost the whole plot
feel sorry for what it could have been tmfp
Well ftsewhoopie, looks like you did indeed try a divergence trade. If you want to know more about it ask, I’ve paper traded it for over 6 months before using my own money. There are certain conditions to be met before we enter a divergence trade
Always willing to listen to advice mate, I’m relatively new and just on small trades at the moment, trying to feel my way into it slowly.
And that my dear friends was a true divergence on a 1 min chart. Look at it fall now
Nah 20 not going to break. Mostly retest of lows
Gapped up!! That’s cheating! Short at 44
Dow?
Out at 55!! Change of trend potentially
looks like a 5 wave formation
Yes I have been seeing these gaps on 1 min charts. It quickly gets filled but I have seen it twice on dow between yday and today.
The gaps are appearing at key support or resistance levels. When I say key its really on the 1 min chart…
Icarus and Hugh Just a late thanks for earlier advice/ replies been at the day job. Will keep at it and trial the ideas. Good weekend all. Lolling forwards to more mayhem on Monday.
cheers Coombsy.
Ftsewhoopie, will try and pull out a note on my divergence trading and post soon
Icarus would you mind letting me know, what point did these gaps occur and where do you get the resistance and support levels on the 1 min chart. I’m only a few months in and still have difficulty trying set things up still! many thanks
Milka, I saw the gaps 3 times today. I remember around 17:01 today, when I entered the trade at 60, the market went up to 16720 and was trying to break that area but couldn’t after multiple tries. I closed my position and I saw the market gap up the 720 area and head straight to 25-30 area. That was the open of the next tick. The gap appears to have quickly filled. The retrace to 760 confirmed bullish divergence signal on a higher timeframe I.e 15-min
Second occurrence was when, the market finished the retrace and was coming down to 720. Because it was resistance earlier, it now was support. I would have gone long as that created a hidden bullish divergence signalling continuation of trend and because the move to 760 was a 5 wave pattern I was nearly convinced..But behold!! The market gapped down and continued its journey down. This confirmed with a bearish divergence signal on 15 min I think…
Don’t know if it all has some hidden meaning but it just felt strange that th market gapped up and down at exactly the same level.
If I look at th charts now, the gap doesn’t exist, but in the live market when I watched every tick there definitely was a gap.
I wouldn’t loose a minute’s sleep over it though 🙂
Never thought we’d see a 5 for a few years yet. SB firms must be rinsing it at the moment!
Me neither.