
Good morning. Was a little bit too early shorting at 6190 as it popped up to the stop level at 6205 before dropping, though the bulls did fight back following the favourable Draghi press conference about more QE and another ready to do whatever it takes type comment. Overnight hasn’t been quite as favourable for the bulls and we are just above 6100 as I write this, with the NFP news due out today at 13:30. Expect volatility then! Also, US markets are closed on Monday for Labour day so the late afternoon might be a bit quieter. “We have very light volumes, a big U.S. holiday on Monday and with payrolls tonight, investors not doing much besides taking some risk down,” said David Welch, head of equity sales trading at Reorient Group in Hong Kong. “Yesterday’s bounce was artificial with China closed, and with the U.S. payrolls data tonight, people are taking risk off.”
US & Asia Overnight from Bloomberg
Asian shares headed for a seventh straight weekly slump and industrial metals slipped with the Australian dollar amid concern that China will pare back support for its stock market on Monday. U.S. equity-index futures fell before payrolls data, while the yen jumped.
The MSCI Asia Pacific Index was set for its longest weekly losing streak since 2011, while Hong Kong’s Hang Seng Index headed for its worst stretch since the collapse of Lehman Brothers Holdings Inc. in 2008. Copper, nickel and zinc fell with Australia’s currency, with Chinese markets closed for a holiday. The yen rallied toward its biggest weekly gain this year, and the euro was little changed after central bank officials signaled on Thursday they’ll boost economic stimulus if needed.
“There’s nervousness in the market about growth in Asia and the implications of the Fed changing policy should payrolls be seen as clearing the way for a hike,” said Sean Callow, a strategist at Westpac Banking Corp. in Sydney. “The fact that dollar-yen in particular is looking soggy is obviously a bad sign.”
The August nonfarm-payrolls report Friday may add fuel to the debate over whether the U.S. economy is strong enough for the Federal Reserve’s first interest-rate increase since 2006. Investors have pared bets on a September liftoff to 30 percent amid turmoil in global markets over the past month. Mainland Chinese markets will open Monday after signs of government intervention to prop up share prices before the nation’s World War II victory parade this week.
Stocks
The MSCI Asia Pacific Index dropped for the fourth time in five days, losing 1 percent by 12:57 p.m. in Tokyo as Japan’s Topix index declined 2.1 percent. The Asia-Pacific benchmark has fallen 4.8 percent this week and is down 15 percent since the end of June.
The Hang Seng Index dropped 0.5 percent on Friday. It’s heading for a 3.6 percent drop since Aug. 28, the seventh weekly decline in a row. The gauge has retreated 18 percent since July 17. A measure of Chinese companies listed in the city fell 1.7 percent to a two-year low Friday, down more than 6 percent for the week.
Futures on the Standard & Poor’s 500 Index slipped 0.7 percent. The nonfarm payrolls report represents the last major data point before the Fed meets on Sept. 16-17. U.S. markets are closed on Monday for Labor Day.
Futures traders have cut the probability of a rate increase in September from 38 percent at the end of last week, according to data compiled by Bloomberg. The figures are based on the assumption that the benchmark rate will average 0.375 percent after the first hike.
Australia’s S&P/ASX 200 Index fell a second day, retreating 0.1 percent to bring its drop in the week to 4.6 percent, the most since early June. The Kospi index in Seoul declined 0.5 percent.
The Dow Jones Industrial Average pared back an almost 200-point rally Thursday as traders cut holdings before the payrolls data, while Treasuries climbed amid the ECB’s comments on stimulus.
Currencies, Bonds
The yen, regarded as a haven in times of volatility, added 0.6 percent to 119.35 per dollar. It has climbed 2 percent versus the dollar this week, the best performance among 16 major currencies, and the biggest such advance since the five days ended Dec. 12.
Yields on 10-year U.S. notes dropped two basis points to 2.14 percent Friday, after slipping three basis points last session. Even though the Fed may be on the cusp of raising interest rates, 10-year Treasuries outpaced their Group of Seven peers during the August equities swoon.
The euro was on track for a second week of losses, the first two-week decline since July against the greenback, trading at $1.1125 after Thursday’s 0.9 percent slump.
The euro’s losses were fueled by the ECB’s decision to raise the limit on bond purchases per issue under its quantitative-easing program, as well as President Draghi’s comments that officials are willing and able to act to meet inflation targets.
The Aussie weakened 0.7 percent to 69.69 U.S. cents, and touched its weakest level since April 20, 2009. New Zealand’s dollar also lost 0.6 percent.
“We have very light volumes, a big U.S. holiday on Monday and with payrolls tonight, investors not doing much besides taking some risk down,” said David Welch, head of equity sales trading at Reorient Group in Hong Kong. “Yesterday’s bounce was artificial with China closed, and with the U.S. payrolls data tonight, people are taking risk off.”
Wheat futures dropped to a four-month low in Chicago on Friday, set for a 4 percent weekly decline on signs of ample global supply.
Copper fell 1 percent after rising to a three-week high in London on Thursday. The metal is 1.1 percent higher this week to head for a second weekly increase. [Bloomberg]
FTSE Outlook
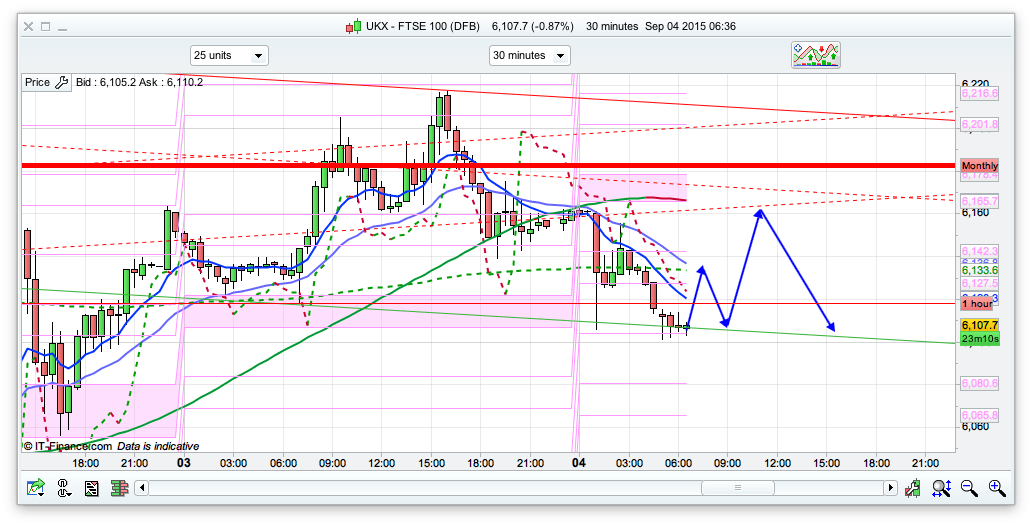
Its NFP Friday today so I expect it to be a little choppy and also with the US closedown Monday a fairly risk off sort of day, especially towards the end. Looking at the short term charts the moving averages are pretty bearish at the moment, and shorting the spikes seems a better play today. I have resistance at 6140 and 6165 is the daily pivot so those levels look decent enough initially. I think the bulls will try and defend 6100 quite hard to then try and build on yesterdays rise next week but today I can see maybe being a bit lacklustre. Time will tell! If 6100 were to break then the next decent support is down at 6012 and 6000 for the bottom of the 10 day Raff. I might be a bit more optimistic next week though for the FTSE to push up towards 6300/6400.
Waiting for going long both ftse and dax..
Any one going Long today??
Currently short 20 target 6080 zax
Not today, maybe next week, we’ll see. If there are any quick moves towards 6000 maybe yes. This is either the beginning of the oncoming bearish or bullish action.
I decided not to take sides while the fight is on.
6100 seems to be widely viewed as important. Big round numbers which are also technical usually get attacked.
With a weird Monday coming up, China reopening and US shut, depends what “risk averse” translates into. Could get a bit bloody later, can’t see where much buying would come from.
Good resistance call at 40 Nick.
Looking to go short after NFP assuming we just chop around before then.
Explain please, ZZ, what’s the plan?
🙂
Expecting this to go back up to 6114 at least by NFP – possibly higher. If we get a small NFP rally I’ll be selling into it expecting a drop back to the end of the day or after hours. Can’t see anyone in the US wanting to hold long with Monday being a holiday. Gap at 6114 which is why I think it might get there 🙂
The other scenario is that we just carry on south – next stop 6040? The 2-hourly TSI is just going negative – usually a good bet to sell into any strength. Expecting more down Monday and then back up on Tuesday when the US come back on stream with all guns blazing?
Morning All
All looks a bit Southerly to me .
50 % Support here at 6100 (5981 – 6218).
Lots of backing off the uptrend line.
Not trying to trade today ..
http://td.md.it-finance.com/ProRealTime_demo/display_chartimage.phtml?name=weubwp9npz1rxalthzqy07v02&type=png&purpose=file
How did Grommit end up yesterday, Hugh?
Pretty good – and coped today.
Wondered if you’d like to email me..
statsuk@aol.com
Shorted at 6097 looking for a drop to about 6020
Brave call mate, you may just be right.
Do you have a stop in mind?
GL.
I’ve got it quite tight at 6110, I think above that and we may head back to Nick’s resistance at 6140.
6110 might just get clipped zax, I’m possibly looking to add around that area if it gets there, just my opinion, what you think tmfp
sorry ftsewhoopsie
Don’t ask me this morning Pete, I haven’t got a clue.
I don’t like the way it just waltzed through supposed support at 6100 and parked up underneath it.
That’s bearish for me.
The only reason I am favoring longs is because the price is at the eMa. I would expect the second successful retest of 6000 area as a potential for longs. Otherwise its going down
took 68 this morning from my crap entry of 6175 yesterday. Going to wait until the payroll numbers come out now. Good news for me will be bad news! >200k
That’s pretty good for a crap entry 🙂 What time did you sell that then?
got the bottom – but missed the 6140 re-entry
my entry was just after Draghi! Ran -45. Sometimes it works!
No, I meant the 6175 short, when did you sell it, before 6217 or late on?
around 8.30 this morning. was a good exit
Crossed messages.
OK, yeah that was quite brave, yesterday was a silly high day with hindsight, couldn’t get my head round it at all.
seemed to follow oil yesterday on that trip to 6220
I’ve been following these PRT lines
(tmfp – Don’t want to give you a migrane ! )
– after feeling a cold chill towards them – I warmed up a bit – then a bit more and now beginning to quite like them.
What I’m finding is the best thing to do is print the chart
(This opens in Firefox which is my default browser).
Right click on the chart
“Copy image location”
Paste it into a excel spread sheet cell – (design away)
Then you’ve got these for reference.
Here was yesterday’s at 10:53
http://td.md.it-finance.com/ProRealTime/display_chartimage.phtml?name=9vpdbcpimj7fz5kyka55csowk&type=png&purpose=file
& Again at 8:30 pm
http://tc.md.it-finance.com/ProRealTime/display_chartimage.phtml?name=x0uh7thofwk3bnrsbhkt7n8oc&type=png&purpose=file
I’ve posted – but it’s awaiting moderation because of the links probably..
Here it is without …
I’ve been following these PRT lines
(tmfp – Don’t want to give you a migrane ! )
– after feeling a cold chill towards them – I warmed up a bit – then a bit more and now beginning to quite like them.
What I’m finding is the best thing to do is print the chart
(This opens in Firefox which is my default browser).
Right click on the chart
“Copy image location”
Paste it into a excel spread sheet cell – (design away)
Then you’ve got these for reference.
Hugh
Could you give an explanation of the charts please.
What are the Green /Red Lines?
Solid & dashed?
Horizontal & angled?
& what is the signal?
or how do you interpret it?
& what is this excel sheet you are talking about
Now if you have not been able to give tmfp a migrane
i certainly have!!!
Paul – The lines are Pro Realtime Auto Trend lines.
Just think of them as S & R & Trendlines & target areas.
They are coloured depending if they are above or below the price.
So – if you’re trading a 1 min chart 6090 will be red if the market is below this price – it will turn green if it closes above (2nd bar in I think). On a 1 hour chart – the same line the colour would be different depending on the price..
Also the line levels are on the right hand side of the chart in the boxes. The oblique levels change with time.
How I’m interpreting them – use them as any S & R or Trend Line
Sell at resistance – Tgt Next Level
Long at Support – Tgt Next Level
Watch for failures.
Excel spreadsheet – you can reference the chart location and paste it into a cell and then refer back to it.
It’s hard to go over all this in text ! – Have a go over the w/e .
Hi Hugh,
I would say them charts are handy if you can read them, as its good to have something extra to add to making a discussion, do you get them of IG, I see they have advanced charts but they looked a bit complicated, so I use the standard, but I must look at them again
Pete – Yep they’re on advanced charts & yes agree with you totally sometimes the standard charts are clear and easy to understand – I love the ipad charting they do . LoL you could have a multiple screen system running with ipads – expensive though !
http://tc.md.it-finance.com/ProRealTime/display_chartimage.phtml?name=24p292s2xqht7env56lnn6p0c&type=png&purpose=file
Hugh
the diagonal lines – what are they?
are they the same as what nick sometimes says prt line?
Yes – Same as Nicks – They do change though throughout the day sometimes…
However …this is what I suppose I’m referring to about keeping them as a reference as they can still be relevant – especially the horizontal ones.
The dashed lines are “minor s& R” – the thicker ones Medium to Major.
Another chart here
http://tc.md.it-finance.com/ProRealTime/display_chartimage.phtml?name=24p292s2xqht7env56lnn6p0c&type=png&purpose=file
Hugh
thanks
you said the prt lines drawn automatically
is this the same case with the dashed minor s&r and thicker major line – drawn automatically?
Yes Paul
They’re all drawn automatically.
With the diagonal lines, what I didn’t make clear perhaps – is that the value of the diagonal line changes over time depending on the angle of the line.
The values on the right hand side are as they are that particular bar.
Hope you followed that !!**
Anyone trading today?
Guess we’re all waiting for the big event !
I suppose everyone is nervous to see what will happy when China re-opens also…..
I’m thinking of a little long if it gets to 60
Moved my limit to 70 hopefully close for 50points although I will probably close before nfp what ever I have, a bit surprised here, was kind of thinking the market would have tried to suck in a few longs before dropping, so its hard to call
its on the verge of popping to 6105
Yea watching here Paul
Closed @90
Impulse move to yesterday’s highs will be a bearish sign. Impulse move to 16000 on dow, may turn out to be a bullish sign. Need growth on 4hr to resume after the retest or will short the dead cat up
Long 90, see how it goes
needs to break 6100 fairly quickly
out +2
Quiet in here???
Yeah Darren, that’s because motormouth here’s been out for a couple of hours 🙂
So, ~50k undershoot on NFP’s and we go down to 6040 and up to 80.
Makes sense. lol.
This afternoon looks basically untradeable so I’m not going to bother, if I had to guess the next 30 points I’d say up (100 before 40).
Have a good weekend chaps.
Catch you later tmfp,
Cheers tmfp. Have a good weekend everyone!
Yea Darren I thought something was wrong with my connection!
Thinking 70 long
Test