
Good morning. The FT100 opened positively on Friday after the China markets stabilised overnight, pushing up through the 6000 level. This appeared to be the start of a sustained recovery only to see sellers coming in mid morning. Positive US Non-Farm payroll figures gave another push up for the FT100 with another breach of the 6000 level before a more sustained and aggressive selling phase continued through to the close of 5912.
The key problems are still the effects of a slowing China economy and its impact on world exporters with very little sign of a recovery. Oil is also suffering from lack of demand and over supply which is knocking the FT100 as it is heavily weighted to oil and commodity shares.
This was the worst week for the start of a New Year since 2000, so this shows how severe trading has been this week.
US & Asia Overnight from Bloomberg
Asian stocks declined, with a regional measure falling to its lowest level in more than four years, as concern about China’s growth outlook continued to fan a global selloff.
The MSCI Asia Pacific excluding Japan Index tumbled 2.1 percent to 374.20 as of 9:44 a.m. in Hong Kong, heading for its lowest close since October 2011, after sinking 7.1 percent last week. Markets in Tokyo are closed Monday for a holiday. Turmoil in China’s markets rippled around the world in the first week of 2016 as the securities regulator scrapped an equity circuit breaker after just four days and the central bank set a weaker yuan fix for eight days in a row, escalating fears of a global currency war.
“The market is concerned about China’s financial stability, with investors looking for more visibility about how the new foreign exchange regime is going to work,” Matthew Sherwood, head of investment strategy at Perpetual Ltd. in Sydney, which manages about $21 billion, said by phone. “People are also quite nervous about the Chinese economic outlook. China is certainly slowing on a very gradual path down. A lot of people are fearing a hard landing is in play, but that’s not our central scenario. There’s a lot of policy ammunition left in China.”
Yuan Fix
China’s Shanghai Composite Index slid 1.5 percent, while the Hang Seng China Enterprises Index of mainland stocks traded in Hong Kong declined 3.2 percent. The offshore yuan erased early losses after China’s central bank kept the currency’s daily fixing stable for the second day in a row.
China’s consumer price index rose 1.6 percent in December from a year earlier, the National Bureau of Statistics said on Saturday. That followed a gain of 1.5 percent in November. The producer price index fell 5.9 percent, extending its record run of declines to 46 months.
Australia’s S&P/ASX 200 Index fell 1.9 percent and New Zealand’s S&P/NZX 50 Index lost 0.9 percent. South Korea’s Kospi index slipped 0.9 percent. Hong Kong’s Hang Seng Index sank 2.5 percent. Singapore’s Straits Times Index dropped 1.9 percent and Taiwan’s Taiex index slumped 1.8 percent.
E-mini futures on the Standard & Poor’s 500 Index dropped 0.6 percent on Monday after U.S. stocks capped the worst start to a year on record last week.
Employers added 292,000 workers to payrolls in December, exceeding the highest estimate in a Bloomberg survey and putting the gain for all of 2015 at 2.65 million, a Labor Department report showed on Friday. [Bloomberg]
FTSE Outlook and Prediction
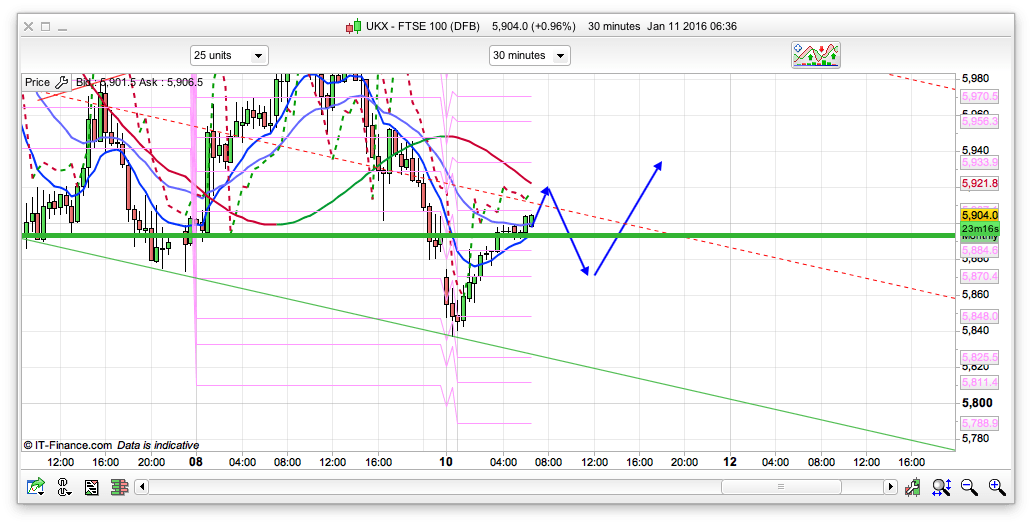
After a fairly bearish Friday and a weak opening to the week in Asia, the bulls have managed to bounce the FTSE quite nicely off the 5850 level and the 10minute chart to start the week doesn’t look as bearish as it could have done. It’s actually showing support from the moving average at 5887, with 5866 below that, so if the bulls come out fighting this morning at 8am, we might well see these levels holding and a rise back up. On the daily chart however, we have 6097 as 25ema resistance so the bulls will need a special week to break back above 6000 and then that area as well. The 30min chart has resistance at 5920 initially which might well cap any early bull activity, but could well give us a dip to load up a long on, if we play out as per the arrows. If the bears break through the 5850 support then the next area of note is 5825 and then 5770
Morning all – who fancies 6000 today!
🙂 I’m expecting up in the A.M and down a bit later,close a bit positive then down tomorrow.Dont know about G.B Ind Prod Tues,but Thurs is a Carney,”Super Thursday”,so already feel nauseous about having to be this close to a North American Ego,doubt if I’m alone in that,I’m sure he will say something to get a response.If we get through the Day Pivot 44/46 depending on how you calculate then low 80’s maybe for a high ??
Unlikely custard. 5940 at best, but more likely 5900
Morning..Fair assessment WSF
We’ve reversed as we approach the Pivot (5946)
then lower high > suggesting test 5910 maybe.
So 6000 Custard seems unlikely at the moment.
Seems wrong that Rolf Harris has outlived David Bowie by almost 20 yrs.
Morning Hugh, can I ask you about pivot points. I know there are different ways of calculating them 24 hrs or market open hours only. Which do you use and is there an advantage to using say market hours over a 24 hour period. IG use 24 hr and this is wildly different from open hrs.
Hi Coombsy – I just use the Cash pivot not for any particular reason.
I hardly ever look at the IG Pivot (24Hr)
I’ve just had a look at these – Pivot @ 5853 – I’m wondering if that uses Sunday data as well.
Seems to me to work with the cash pivot’s as they are more “realistic” in my mind.
Thanks high I think I might keep a closer eye on the cash pivots from now. I might ask IG if they could give us the option. They probably use the 24 hr ones to throw us off course a bit.
Coombsy – If you’re using IT charts – have you tried doing reconfiguring the time zone.
But you can get them here (updated at midnight)
http://www.livecharts.co.uk/Members/display_stock_pivots.php
They only give a daily weekly and monthly time frame on the parameters for the pivots. Which is a bit odd. I am using the mobile app and wonder if any different on the PC version. Will have a look. Cheers for the link too.
Hi Coombsy
I’m a big fan of pivot points and use them all the time for FTSE day trades. But I would never touch the 24 hour pivots which IG produce. The pivots on a Monday take into account that pointless Sunday trading they do where the market usually moves by one point as well as 24 hour data which seems to be made up half the time.
The idea of using pivot points from the cash market is that 99% of market participants – hedge funds, investment banks etc use them. They’re not looking at spreadbet charts and when those guys trade they really move the market so you want to follow the same levels as them.
Thanks Dan, that really makes sense. Will definitely change to the cash ones and see how I go. Thanks Dan and hugh.
I keep looking at this USD/JPY !
Waiting for this to touch 11809 before there’s any resolution on the FTSE direction.
Seems to me the channel is clearer on the USDJPY.
Sorry forgot to put chart link in..
http://ee.md.it-finance.com/ProRealTime_V10_2/display_chartimage.phtml?name=4yvokv5eeglz9g52ji768oqiv&type=png&purpose=file
Anyone know if the support resistance and pivot points on http://www.biancatrends.com are from the cash markets?
yes they are, same as the pivots listed on live charts
Thanks nick, this trading can be a like trekking through minefields, I certainly wouldn’t be doing this without your site.
Hi – Very quiet so been getting on with other stuff.
ASX has just signaled RSI T 4939 – so if it gets carried a tadge higher may look at this..
Here is USOIL may get upto
http://lol-fx.ml/bat/
Hope you all find it useful.
Looking to go L 6898 S 10 (Trio Trade)
** L5898 S 10
Changed to 5892
Closed 5917
Nice timing,Dow seems to be a proxy for Oil now.
Lower Highs – Lower Lows
Next stop 5850-55 I guess
See what happens if the Dow has another run at 200 I suppose.
WSF I was just projecting the trend lower.
It’s a bit odd this area – there’s nothing to latch on to apart from
the 5864 that Josh Mahony has mentioned & the 5775 (24th Aug Low)
http://ee.md.it-finance.com/ProRealTime_V10_2/display_chartimage.phtml?name=gpm8au8b4rx3jcc1qtxzggjv7&type=png&purpose=file
5845 from the overnight is at the last run at 16200,so I wouldnt discount that.
Evening All,
Different format tonight
http://imgur.com/j5f4Bo5
Short Position Possibles
Date Action Level Stop RR Target 1 Target 2 Target 3 Reason
12/01/2016 Short 6014 6024 10 6004 5994 5984 1 Hr Prt
12/01/2016 Short 5992 6002 10 5982 5972 5962 Minor PRT OL
12/01/2016 Short 5941 5955 14 5927 5913 5899 Previous Res.
Long Position Possibles
Date Action Level Stop RR Target 1 Target 2 Target 3 Reason
12/01/2016 Long 5895 5885 10 5905 5915 5925 Bounce off Pivot
12/01/2016 Long 5875 5882 10 5885 5895 5905 PRT Mnthly Line
12/01/2016 Long 5845 5835 10 5855 5865 5875 Previous Supp
12/01/2016 Long 5791 5781 10 5801 5811 5821 PRT OL
12/01/2016 Long 5768 5748 20 5788 5808 5828 J Mahonys Level
Well not a bad day. Only +6 overall for the day. But a profit is a profit. See you tomorrow.
Nothing dodgy about that Dow close at all.
Evening All,
Different format tonight
http://imgur.com/j5f4Bo5
Short Position Possibles
Date Action Level Stop RR Target 1 Target 2 Target 3 Reason
12/01/2016 Short 6014 6024 10 6004 5994 5984 1 Hr Prt
12/01/2016 Short 5992 6002 10 5982 5972 5962 Minor PRT OL
12/01/2016 Short 5941 5955 14 5927 5913 5899 Previous Res.
Long Position Possibles
Date Action Level Stop RR Target 1 Target 2 Target 3 Reason
12/01/2016 Long 5895 5885 10 5905 5915 5925 Bounce off Pivot
12/01/2016 Long 5875 5882 10 5885 5895 5905 PRT Mnthly Line
12/01/2016 Long 5845 5835 10 5855 5865 5875 Previous Supp
12/01/2016 Long 5791 5781 10 5801 5811 5821 PRT OL
12/01/2016 Long 5768 5748 20 5788 5808 5828 J Mahonys Level