
Good morning. What a crazy day that was. A fall to 5600 then a rally to 5780, all the while the Dax only dropped 200 points, before rallying 400. Crazy and sometimes its better to just stand aside rather than try and second guess where its going to go. Dax probably held up in anticipation of the ECB todays and seeing what Draghi is going to say. Meanwhile, China’s central bank cranked up cash injections in its money-market operations for the third week in a row.
Market review for Wednesday
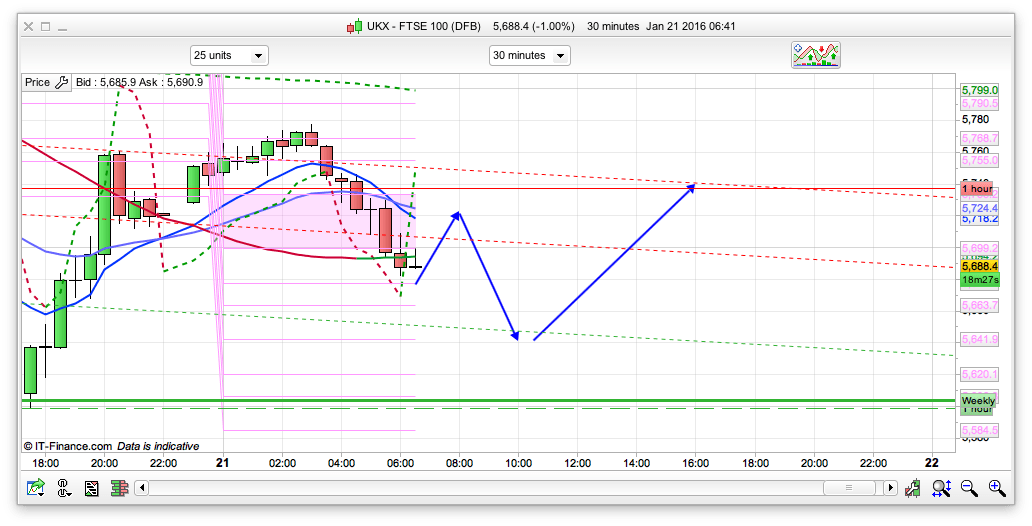
Wall Street has over the last few days repeatedly knocked any rally the FT100 has been building during the day and this happened again yesterday. With an open around 5760 the FT100 fell to 5700 then attempted to rally into the Wall Street open reaching 5725. Once the Wall Street bell had rung the markets dived on further weakness in the oil price with the FT100 touching 5650 before closing at around 5673 – down 203.22 points! In after hours trading the FT100 broke below 5600 for a short while before recovering to 5700 at around 8pm UK time. No one knows where the bottom is, however this could be the “Blow out” day that finally clears out the weak bulls … so maybe this was the low.
US & Asia Overnight from Bloomberg
Asian stocks gained, easing a selloff in global equities that brought the regional benchmark index to a three-year low, as crude oil advanced after plunging below $27 a barrel.
The MSCI Asia Pacific Index climbed 0.5 percent to 117.18 as of 9:50 a.m. in Tokyo. The gauge tumbled 12 percent this month through Wednesday, heading for its worst month since the depths of the global financial crisis in 2008. Global equities have fallen more than 19 percent from a record high reached in May, with Japanese shares plunging into a bear market as tumbling oil prices fed concerns over the global economic outlook.
“A sensible strategy is to buy through these periods of volatility in a number of stages since you can’t pick the absolute bottom,” Martin Lakos, Sydney-based strategist at Macquarie Private Wealth, said by phone. “There’s some very good value in the market particularly if you’re looking at earnings momentum. Ultimately sense will prevail and investors will focus on fundamentals. We’re not seeing the economies in China, U.S or Europe falling off the cliff.”
E-mini futures on the Standard & Poor’s 500 Index climbed 0.6 percent on Thursday. The U.S. equity benchmark index closed 1.2 percent lower at a 21-month low on Wednesday. A late-day rally paced by health-care and small-cap shares helped trim declines of as much as 3.7 percent.
March futures on West Texas Intermediate crude rose as much as 1.8 percent after losing 4.1 percent the previous session. The February contract expired Wednesday at the lowest level since May 2003 as energy producers turned gloomier on the prospect of a recovery this year. Energy shares had the biggest gains among industry groups in the MSCI Asia Pacific gauge on Thursday.
Oversold Signal
Investors are looking for evidence stocks have hit a bottom, as some market indicators signal the equities selloff has gone too far. The 14-day relative strength index for Japan’s Topix fell to 24.35 on Wednesday, below the level of 30 which some traders say indicates that shares will rise. When the measure slid to 24.4 on Jan. 12, the Topix jumped 2.9 percent the next day.
Japan’s Topix index increased 0.9 percent after slumping 3.7 percent on Wednesday. Both the Topix and the Nikkei 225 Stock Average lost 21 percent from their peaks through Wednesday. The Nikkei 225 last entered a bear market in June 2013, after plunging 20 percent in less than a month. The gauge soon rebounded, rallying 31 percent from its low on June 13, 2013, through the end of that year.
Australia’s S&P/ASX 200 Index rose 1.1 percent, after closing Wednesday near a 20 percent drop from last year’s high that would have met the definition of a bear market. New Zealand’s benchmark gauge slipped 0.4 percent. South Korea’s Kospi index added 0.3 percent.
China Futures
Markets in China and Hong Kong have yet to start trading. Futures on the Hang Seng China Enterprises Index slipped 0.9 percent in most recent trading, while contracts on FTSE China A50 Index lost 0.5 percent and those for the benchmark Hang Seng Index fell 1.3 percent.
Chinese stocks in Hong Kong tumbled on Wednesday to the lowest level since the depths of the global financial crisis as a slide in the city’s dollar spurred concerns over capital outflows. The Hang Seng China Enterprises Index plunged as much as 5.5 percent before paring losses to 4.3 percent at the close in Hong Kong. The Shanghai Composite Index lost 1 percent. The benchmark Hang Seng Index dropped 3.8 percent to the lowest since July 2012.
Policy makers in China and Hong Kong are fighting to prevent a vicious cycle of capital outflows and a weakening currency with the resulting financial-market volatility heightening concern that the mainland’s deepest economic slowdown since 1990 will worsen. [Bloomberg]
FTSE Outlook and Prediction
I find days like yesterday hard to trade unless you are already in a position or fancy a gamble, mainly as supports or resistance levels tend to break pretty easily and you just get chewed up. Anyway, for today, I have some weak initial support at the 5670 area, which if that holds may see us rise towards the 5725 area where we have the 30min 25ema resistance. The bottom of the 10 day Bianca channel today is at 5641, and this might well see some brave bulls start some buying in anticipation of the ECB and Draghi later on at 12:45. Whilst rates and stimulus are anticipated to remain the same, his press conference at 13:30 will be the real mover to see if he delivers another “do whatever it takes” moment. We might well see a bit of buy the rumour sell the news going on today. That was a pretty decent bounce last night from 5600 on the FTSE, 9250 Dax and 1810 S&P – so there are some buyers still around (algo’s/plunge protection team probably) so we may see some more of that today. There is a lot of fear around and panic in the media, some of it justified but when everything is hysterical tends to be when we get a bounce, albeit possibly of the dead cat kind. We may get lower still – 5400 or possibly 5200 – so its pointless trying to call a bottom at the moment. So, brave long around the 5640 area later on today.
I think the bottom has been hit for the while, some good stimulus promise from ECB later and can see DAX back to 9900 by tomorrow close with FTSE up to 5850.
Would be good. Hopefully dip to 5640 on this leg down to get long on. Shorted that early rally on Dax and S&P. Had a FTSE short order at 5730 which missed by 0.3!
Well, didn’t get filled at 5600, sadly but got taken out of the lot at 5750, happy days. Lets see what today brings but I think anything below 5700 and I’ll have my buying finger out.
EDIT… Taken out at 5740.
Nice chippy, you’re getting a bit of swing in the groove. Did you long the weakness?
Been “out of range” since early this morning so no didn’t get any cheap ones. In fairness I don’t think I would have been piling in at 75 anyway.
Yep, had a pretty good month so far!
Morning.
Certainly was a crazy day, first time for a long while that I have traded in three different hundreds in 12 hours. And, as Nick says, with the DAX behaving as if on a different planet (arbitrage opportunities there).
Talking of Nick, brave headline call this morning, I really hope you didn’t miss that 5730 short for the sake of 0.3 if you were trading IG, mate.
Also, spare a thought for our host you guys that are signed up for him, hugely stressful in these wild markets to put your neck on the line day in day out for yourself, let alone other people too. Everyone’s seeing MSM headlines and expecting bucketloads of profit. It’s not that simple.
ECB Rate announcement at 12.45 and bs 45 minutes later. Basic approach buy the hype, sell the fact should work. Prior to that, what Nick says.
GL all 🙂
Unlucky Nick, I just read what you posted while I was typing 🙁
Got a little rsi long on at 60, will run it b/e stop for a while, maybe 700 again?
Might get a little overbought dip off 80, looking to add to long low 70’s.
took +33, feet under table
Annoying. Got the Dax at 9465 and S&P at 1863 so 2 out of 3 triggered
Good, I’d go for 2 out of 3 anytime 🙂
Thanks. It is hard to pin your colours to the mast at 7am for the day ahead, thats for sure! Even more so when its like this!
Long again 75, will it make 700 this time?
Lower high…stopping if DAX goes to 75
stop to 5670
took impatient +15
replaced at 85 looking for break of highs led by DAX 10 pt stop
took another impatient +15
Morning all,whatever happens from 12.45 Draghi gets another go tomorrow morning,speaking to the Lizards at Davos before Breakfast (whatever that actually is) 🙂
Too much to expect he’ll announce his gold platter retirement, poxy merchant bank stooge.
From Wikipedia, what’s wrong with the world in one sentence
” In 2015 Fortune magazine ranked him as the world’s second greatest leader.”
Who was first, Kim Jong Un?
🙂 they do say theres no real € in Draghi.
Looks like it’s still got a bit of upside in it, but too rich for my blood above 5700. Looking to short in 20’s depending how it gets there.
Very short term uptrend broken but a secondary at around 90, maybe worth a small long
Minimal long at 92 see if it holds
stop 89 now
Our line broken but DAX line at 9440 still good but that’s 3 micro fails at 05 for us
Morning All,
Did one of my dissapearing acts again 🙂
– Busy week.
Range 5692 – 5705 – nice little trade there tmfp.
PRT down trend line on 1 min at 5711
out for -2
If DAX loses 430 convincingly that could be it for the upside for a while
Nah missed it Hugh, looking for third time lucky breakthrough, would have sold it at around that prt line without knowing it was there 🙂
FTSE 5686
small S on that break 5688
Tgt 5676
Stop in (Min)
4 hours and I haven’t shorted anything….what’s going on???
I’m not convinced my trade (5688) is any good – just trying to follow what I’m looking at ! 🙂
Break of 92 & weakness at 5705
That DAX 430 is looking like a do not cross line. Makes the potential fall all the bigger if/when it does but doubt much pressure before Draggi
Force open Long at 57 93 – Limit 5704 . S Min at the Mo.
It’ll find it’s direction one way.
Off to do a bit …
Will be shorting 06 with a 10 pt stop if we get there with no pullback, should be 80ish 1min rsi
Bored spec long for the break out at 99, 10 either way
lol great timing
as my gran used to say “The devil makes work for idle hands”
out for -4 and small short because DAX break of 30.
Rate announcement in half an hour then, expected unchanged with a possible cut in March, don’t know whether that will be elaborated on at 12.45 or the later press conference.
I think I’ll place my +20 short and -20 long orders at 12.43 for small stakes.
Getting minor whipsawed here which is boring, short a bit more at 03 and getting out at b/e av (hopefully).
out at 97
Guys, it’s turning down on Dax, what are we worried about, Draghi? Should I go heavily short?
Or will it be “short the spike” situation?
There’s a miniscule chance of a rate change at 12.45 Jack which would put the cat amongst the pigeons, otherwise just a bit of turbulence.
In the past, the later press conference has meant a rise then fall, don’t see why this one should be any different.
Unless you have strong technical reasons, maybe best to wait till the dust settles.
A big short would be pretty brave.
I’m placing a ftse sell order in a minute at 20 over the price (looking like about 5705) and a buy at 20 under, just to take advantage of any volatility. Hopefully.
Tbh, technical reasons for short are weak.
Good you didn’t by the looks of it.
No I didn’t. But I had short from 2.16-2.18: 9420-9410 on dax and got 10 points on it full stake. Then in doubt asked here. Good I didn’t hold that short. Thanks for advice.
Wow, you picked the bottom there at 10, with hindsight shame you didn’t long.
Ignore that, I hate hindsight trading. 😉
Yep, that’s exactly why I don’t tend to hold anything. Sometimes it saves me like here.
No change as expected. A bit of a ftse relief rally probably because a cut would have meant a stronger £ which Carney doesn’t want.
Technically, 05’s a buy after the breakthrough and return to previous high supposedly now support, so a little long there, 10 stop
Also the right way round for further Draggi hopes on the DAX
Not enthusiastic though
Overcome by a wave of bearishness dumped that long for +5 and scale up sell orders in at 15, 25, 35 stop probably around 50
Not sure about a sustained run from here, lets face it we are up 100 odd points from the lows, pretty quickly. My guess is, without any news, a low volume drift could be in order the next few days but will leave limit buy at 5650.
Back out into the cold for me!
And here we go, hype rally #2,000,000
Not much real DAX resistance till 9625 so says IG Mahony, so I’ll need be bit quick on my feet here
Hi – with you at 25
out -10
another go 64
Yeah nasty feeling I got the timing all wrong on that out for -27 x 3 ouch
Let’s try again short 65, 80, 95
+12 still short orders
Just wondering when this rally is going to roll over the Rsi is screaming
I’m trying a short at 60
Out for +1 a bit nervous tday for some reason
Should of held it!
Better nervous than broke mate 🙂
Will be interesting to see how much the US buys into this,
They tend to be fairly insular about this foreign stuff, but you never know.
Doesn’t appear to be anything concrete coming out of ECB, surprise surprise.
If I had to guess tmfp and it’s only a guess but I don’t think we have seen the last of the 200 sma on the weekly at 15750 area on the Dow just yet.
groundhog day!
200 sma….a line that was touched once in four years, then broken second time?
A bit esoteric for me.
Moving Averages are the finger painting of the indicator world. 🙂
Discuss.
out for +28
Twice tmfp it bounced of it on August 23 last year as well FWIW
Oh you mentioned it twice tmfp my mistake.
hey everone
i managed to got my short at 5762 target 5630
stop 5913
Some good info last night on the Dow gold trader re targets thanks for posting
You are welcome matey, happy pips
Quick Pips out at 5728
Busy again… so going to be quick
Bit messy earlier 5700 area
S on RSI T 5743 & again 5769
All closed – so showing a small +20 approx. including the earlier messy bit 🙂
Loving these Renko charts for waves & Retracements
http://td.md.it-finance.com/ProRealTime_V10_2/display_chartimage.phtml?name=f3tuq963tficvy5uwj5kfrih7&type=png&purpose=file
And there we have it, the classic ECB meeting pump and dump completed, back where we started after 60 points of bullshit.
I’m guessing again tmfp so don’t give me a boll%cking but I think up now on the Dow.Goldtrader any info from you sir?
A nudge of 15900 is my Guess?
Guess away young man, that’s all any of us are doing.
The theory is that informed guesses have a better chance of succeeding than just randomly pulling something out of a hat.
So, it’s ~800 now and you think it will go to 900. Fair enough.
What has changed since it was showing oversold at 700?
Or is your guess progressive ie, it’s going up because it’s going up?
Renko would suggest 15884 – 15900 in the middle of nowhere
http://td.md.it-finance.com/ProRealTime_V10_2/display_chartimage.phtml?name=5o852ky650uqjor9lswe35m79&type=png&purpose=file
No it’s based on that authentic rally at 2.30 am this morning to 15950 ish. There is some method in my madness:0)
That top is is 15920 iiiiishhhhh
I don’t think its about charts on this occasion hugh.
I don’t know what the 2.30 am reference means.
Anyway, your guess was right, 900 touched, hope you made some money.
I haven’t made it my mission to put you down or query your decision making, but saying “I guess this” isn’t really much use as input for the rest of us.
RENKO 1 Box / 1min
http://td.md.it-finance.com/ProRealTime_V10_2/display_chartimage.phtml?name=wl8iraxwy77sdftgvqc2reg60&type=png&purpose=file
tmfp it was this morning on the approach to the A50 opening,the Dow rallied quite strongly and then slowly dropped through the night.I wish I could give you all technical solid reasons like you guys can but I’m not experienced enough technically,but I do see how the market wants to behave to an extent by constant monitoring.Good Luck everyone.
Then say so.
Looking for repeating patterns is a perfectly legit technical approach, I’ve known a number of people who swear by it. If it fits with you, then great.
Technical analysis doesn’t mean copying me or anyone else, it means finding a consistent rational approach that suits you, sticking with it, refining it and making money off it.
“Sophisticated” traders laugh at my rsi approach until I show them the profits.
To quote Catherine Tate “Am I bovvered?”
Ok tmfp next time I will say what I have seen,it’s just a bit intimidating to speak out in the company of many more experienced traders who are all good with charts,I have noticed that quite often my feel for what is going on matches what you guys are doing e.g.that RSI divergence the other day.but ok I will post my views and risk a few laughs :0)
If there was someone here trading by reading tea leaves I’d listen if he was more often right than wrong.
And don’t mind me, I’m a legend for my rudeness irl.
People say “He doesn’t suffer fools easily”, but that’s not entirely true, most fools can’t help being stupid. I just enjoy being rude. 🙂
Ha ha ha you really do crack me up,Im pis@ing myself here,I have found the tea leaves work best if you dry them out first!
There’s a million different types of prediction techniques.
How about ‘chresmomancy’, divination by analysing the ramblings of a lunatic….ring any bells?
I can’t see the bloody screen now I’ve got tears in my eyes lol!
Don’t beat yourself up tmfp,I don’t think you are that much of a lunatic,and if you are at least you are a consistent lunatic :0)
I’m short Dow from 15890
Well I didn’t expect that out at b/e stop boll@cks.
Currently long on Dax from 435 and Dow 740. I’m more of a pattern trader and I anticipate a v-shaped recovery on the daily. On that premise holding these longs, and wait to see if Dow closes over 16k or me getting stopped out b/e.
S&P bounced of 1818 levels and should retest 1896.
should I add at 840 on the Dow and 525 on the Dax ?
I should have backed myself and added those positions. I’m comfortable reducing the position but not adding. Now the wait till US close.
shorting again at 5798
on which index is this ?
short now, its ftse
Coming up to the MHH, near its highs and looking comfortable If you chop out the 13.00 to 14.30 ECB aberration it’s been a good technical performance with a supportive DOW.
DOW’s probably looking at 16000, although showing signs of a blowoff temp top at 15950 just now, but an MHH dip into 40’s would be worth thinking about a long for later.
I’ve small long atm looking to dump in 70’s hopefully first.
Lost my bottle on that since DOW lost 900 so out at 56. Good turn off 705 that, I’ve stopped kicking myself about the ECB f*ck up now. 🙂
Long at 40, 15 either way
Took 20 would go again
too soon never mind, short 80 12 stop
took 10 not sure here
short 72
out for nothing
Added at 843 this time on the Dow didn’t expect that.
closed the added position for 100 points. First position still open hopefully doesn’t get stopped out !!
Yeah nice little buyable dip alround there RJ.
Thanks tmfp, just using one screen and too difficult to switch graphs when its that quick. Checking back it was 847.3 and only 96 points profit.
Hope you are making a killing !!
Nice 90 points in about 90 seconds 🙂
No killing today, yesterday was jackpot day, much lower stakes today, started well but screwed up with the ECB bubble.
A bit After the Lord Mayors Show really, but still finished in the blue (just).
🙂
Looks like I covered my closing short too early as well. C’est la vie.
90 points is good any day tmfp 🙂 See you tomorrow.
Ok here goes be gentle with me! What remains a worry to the market is China,so the A50 is trading very roughly between 9200 and 9500-9600 last night the A50 opened quite low from memory it was around 9200 .my theory is the threat to the Dow is reduced at A50 open if it’s around 9200 hence a possible rally last thing.at the moment the A50 is 9350 ish so in the middle really but still the possibility on some downside so my guess is the Dow with drop a bit later on .
P. S. I Use PG tips loose tea………that Yorkshire tea doesn’t work very well.
I don’t follow the A50 or stay up all night. So what you’re saying is the A50 gives you insight into the DOW close?
But they’re never “open” at the same time are they?
Well I didn’t say I profess to know what I’m doing :0) but last 3 nights there’s been a marked effect on all three indices the Dow the Ftse and the Dax.After all if China sneezes the world catches a cold.
Could it be that the A50 is all about the main themes at the moment ? Read somewhere recently that the South African mkt was a bit of a leading indicator with the current situation for pretty much that reason and that anyone living there and following it could have treated it as a heads up last year.
I didn’t know that WSF about the South African market,thanks for posting that I’m going to look into that now.Good Luck mate.
Think it was just in the context of turning down due to comms earlier than other places,wouldnt take SA as an indicator now,same is probably true of other countries,but there there was maybe less initial withdrawl of foreign cash,which is a major theme with other mkts that got the cheap dollars pumped into them.South Africa is a funny mkt,but if you believed in it just a bit then it might make more sense to look at their big Brewer and Old Mutual on the FTSE,maybe.I dont like Zuma but he certainly is lead by people with weight in their Stock Mkt as with the US leaders and their Mkts though.Australia seems very rocky to be honest and it wouldnt surprise me if they end up lagging any uptrend/recovery,so they might be less of an indicator on a sustained rise(if we get one).Maybe Canada is a better comm’ country to watch,but I guess we arent short of big picture indicators.HSBC is probably as valid and the big picture wasnt what you meant re A50 originally.CMC mkts do good Australia coverage,worth a look at their blogs.
I can’t seem to find too much on the South African market,can you give me any pointers as to where to look please?
Thanks WSF I think it’s good to have a wider view of things though,there is so much going on in the world,and how things relate or not it’s mind boggling.Think I will stick to watching China it seems to have the biggest potential for moving what we trade.im just looking at the Dow 15 min chart to see if I can spot a bullish alignment ,it’s looking possible but I’m not convinced just yet.
Got our first batch of t-shirts back from the screen printers,they have come out great,we could have sold a load in the run up to 1am last night :0)
I was looking at 15 min charts a lot last week with the Dax,was very useful.
Did you see Hugh’s Oil/Ftse comparison chart still think that might be worth tracking.
http://ir.jse.co.za/phoenix.zhtml?c=198120&p=irol-stockQuoteChart
http://www.sharenet.co.za/
http://markets.ft.com/research/Markets/CountryOverview?country=ZA
Yes,although if this is really back to the 70’s we should look at Bellbottoms and Tyedyes too 🙂
anstel my reply is awaiting moderation because of the links.
No problem WSF well we got abit of a roll over and dip there,I think it was a double top.i missed Hugh’s chart about Ftse / oil .i think we will get some rises on these indices in spring and I bet Hugh’s on the money there,I bet the oil price will go up if they stop producing or reduce output of WTI that should help push up oil and hence the markets that should keep everybody happy with the market again after everyone saying its going to crash.All clever stuff oil is the new QE.
Hey if it’s back to the seventies I can get my classical music out again,I’m quite partial to some bananarama and The Rubettes :0)
🙂 I’ve played a lot of Status Quo,Down Down lately,back to back for hours,probably only a coincidence, but my neighbour put his house on the mkt yesterday 🙂
Play that status quo louder and longer and all through the night.i will come round and make him a stupid offer on his house,he will be that fed up he’ll probably take it then while houses are still going up we can bang it back on the market at a few grand profit and split the proceeds :0)mind you I may have to take the plug of your record player till we sell it again………can’t take an chances with noise pollution you know :0)
And the DOW storms 16000 and takes us over 5800!
Interesting Friday coming up, cheers for now.
Blimey, just wandered in from the cold and turned my telly on. “It was all a mistake”!! Still amazes me that someone in the big wide World sold FTSE at 5600 and probably now trying to buy it back at 5800! Mind you gives us lot a chance.
Hands firmly sat on
Dow looks like it could potentially roll over on the 3 min
Now 15850 again.
Well we got our drop on the Dow in the end.
Yeah I think it’s goin up again now till 9 pm 900 ish is my guess.
out of the FTSe short now
According to my tea leaves it might push up again :0) can’t be sure I can’t find my glasses:0)
Evening Chaps,
I’m still finding doing these charts in the evening useful as a road map for the following day.
These are my zones for tomorrow.
http://tc.md.it-finance.com/ProRealTime_V10_2/display_chartimage.phtml?name=myxrie2r78510j3qqxhrhx53n&type=png&purpose=file
&
Larger View
http://tc.md.it-finance.com/ProRealTime_V10_2/display_chartimage.phtml?name=fv6cr7yroc0c2gjijrm3vpu0w&type=png&purpose=file
If anyone is still around at 1am keep your eye on the A50,it’s 9350 to sell,last few nights it’s been down in the 9100 / 9200 areas and up to the 9600 area at the top end all approx but you get the idea,it’s the sentiment that’s important to us not the precise numbers.It is my opinion that if the A50 holds or rises like I think it is going too we should have a Dow over 16000 tomorrow.please bear in mind I’m not good with charts yet but this is based on the market action I have seen in the last 24 hrs and is my interpretation of how I think the market will move going forward Please bear in mind I could be very wrong .Good Luck all.
It is interesting,but this Dow,out of hours run up on low volume etc etc is hard to believe in.I mean it is as if it’s being pushed up and based on recent events cant help wondering if it isnt being pushed up so that it can be dumped later.
ASX 200 at 4955 about another 40 odd would seem to make Dow back over 15950 tonight.
Draghi is at 07.45 U.K time speaking at Davos.
Exactly WSF I noticed it was getting pushed up last night. That’s why I said the t shirts would sell last night if you get my drift. I’m pretty sure the Dow will close tomorrow at around 16100,that’s my take on it.i think the A50 will go up tonight,I can almost feel the positive sentiment.
Can you tell me how I can tell if it’s low volume? is there an indicator for volume?
ASX 200 is through 4914 which is R1 yesterday high was 4930,being pushed now above that R2 is 4964,Dow is up about 80 points in the last 90 mins.looks likely to atleast touch 15950 in a minute.
I’m long on the Dow and I have been hedging as you know,it’s been working out ok did 13 trades tday and lost on only two.i love hedging because if you get gains and then when the market tops out and you short it the worst that can happen is you stay even but then when it’s dropped dump the short and you have a banked profit.just gotta be careful not to get stuck in a bear trap with the short.
The whole bloody lot is going up I’m bloody convinced of it but I’m adhering to strick risk managment whereas before I would have been adding to position now,good thing about going long is it’s less likely to push past you trailing stops like it can with shorts when it collapses in a flash like NFP for eg.
Right all eyes on A50
Re Volume you mean accurate for a share ? it is just the bottom of most charts on most websites delayed by whatever the difference is between the free reporting of trades and the payed level 2,usually a barchart format.With Indices Yahoo or Google or Stockchharts or anyone on daily or more than short term would probably be reliable and at the bottom of the chart,but it would be the total for trades in everything in the Index,so impossible to track live without the info from the exchange.I dont think Advantage Web claims anything.That shaded area at the bottom of the charts looks like it should be indicating something,but I looked it up and apparently it is the number of price changes within a period,so not really the same thing at all.
They arent paying for best data now,you probably noticed they stopped providing the indices Div info in their newsfeed,because they get a cheaper provider now.
Well city do seem to have cut there outgoing costs since they became gain capital.Its all in the name really isn’t it. A50 down to 9276 to sell Dow down to 15876.might just keep an eye on this a little longer.
A50 gapped up 40 points
Update A50 has dropped back to 9330 to sell at 2.40 am.signing off with Dow at 15889 to sell goodnight all and good luck