
Support 5746 5700 5713 5689 5677 5675 5583
Resistance 5788 5847 5895 5950 5997
Good morning.
Market Summary for Friday 12th February
After a week of big falls the FT100 managed to kick back up on Friday. The FT100 recorded its best one-day percentage gain in more than five months with banking and commodities sectors being the best performers, however they were also the ones most affected in the downturn. The main driver for the oil sector appeared to be comments from the energy minister of the United Arab Emirates on prospects for a coordinated production cut which sparked an oil prices rise of 10%. For banks it was positive results from Commerzbank which gave a lift to banks across Europe.
In after hours trading the FT100 moved up a shade more and consolidated around the 5730 level.
US & Asia Overnight from Bloomberg
U.S. index futures rallied as Japanese stocks soared the most since 2008 amid speculation a selloff that brought global equities into a bear market has gone too far.
Contracts on the Standard & Poor’s 500 Index due in March jumped 0.9 percent to 1,874.75 as of 1:45 p.m. in Tokyo. Japan’s Topix soared more than 7 percent, China’s yuan jumped by the most since a dollar peg ended in 2005, while the yen dropped with gold as haven assets fell out of favor.
“Japan is massively oversold,” said Andrew Clarke, Hong Kong-based director of trading at Mirabaud Asia Ltd. “Everyone is scrambling to get back in. Long-only investors are coming in along with retail and hedge funds. Plus, I would say there’s a lot of short covering going on. Also, U.S. shares rallied and we have China’s market back on today.”
Equities around the world are rallying after an MSCI gauge of global equities capped a 20 percent slide from a May record last week. The U.S. Federal Reserve acknowledged the volatility around the world and signaled it may delay further monetary tightening. China’s central bank stepped up efforts to restore stability to the nation’s currency and economy, with Governor Zhou Xiaochuan saying there’s no basis for continued yuan depreciation.
Japan’s Topix surged 7.3 percent, the most since October 2008, after a bigger-than-expected decline in fourth-quarter gross domestic product spurred speculation the central bank will boost stimulus. Financial markets in the U.S. and Canada are closed Monday for holidays.
The global rally started Friday with U.S. stocks halting a five-day decline, its longest losing streak since September, as crude prices rebounded and data showed retail sales increased for a third month in January. The S&P 500 rose 2 percent while the Stoxx Europe 600 jumped 2.9 percent. [Bloomberg]
FTSE 100 Outlook and Prediction
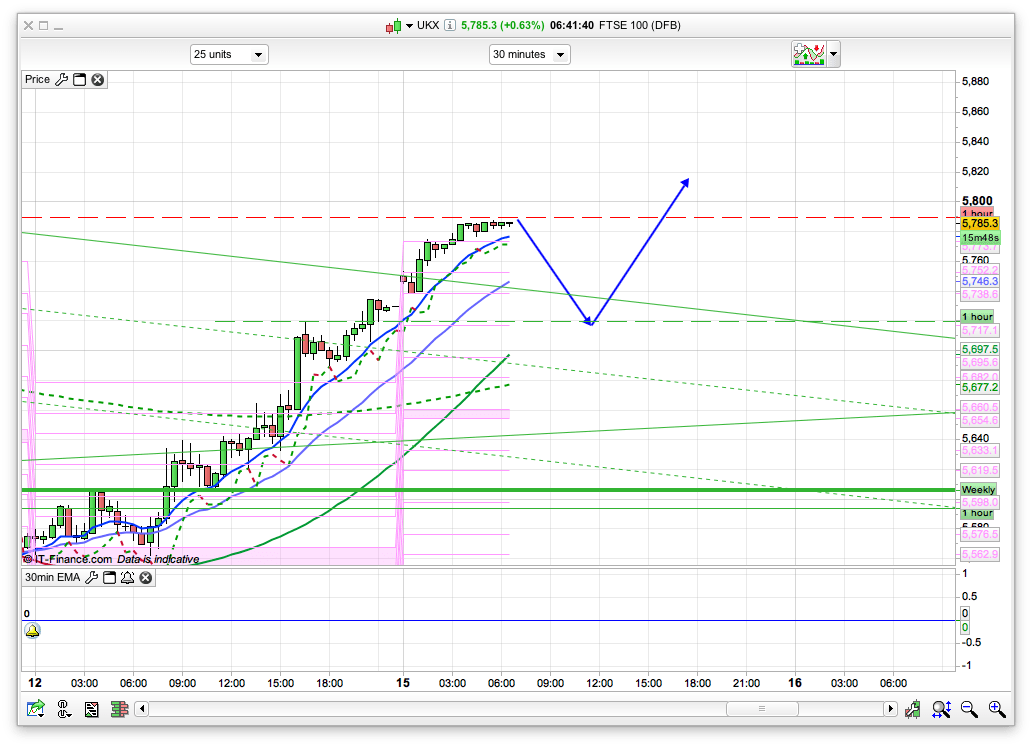
We are sitting on the R1 level as I am writing this at 6am, and I think that we may well get an initial pullback towards the 5715 area to start with this morning. China is back today after their Lunar New Year break and things have remained fairly upbeat with Asian stocks rebounding from a three-year low, led by Japanese shares, amid speculation losses that pushed global equities into a bear market were excessive. As you know I had been looking at 5400 as the low for this leg down, but maybe 5500 is the bottom for the moment, and if this week remains upbeat then we could be on for some upside now. Maybe I was just a bit too bearish! For today, there is support at 5715 which is a backtest of a couple of daily channels , namely the Raff and Bianca, so if we do drop back then this area could well hold. The daily pivot is at 5675 below this for support there, not sure we will get a 100 point drop this morning though but you never know! Things might have bounced a little to far too fast off that 5500 level so a pull back would shake off a bit of the overbought conditions. The 2 hour chart has support at 5583 though I really don’t think we will see that level today. Above the R1 level of 5788 the next resistance level is 5848 for R2 then a major PRT at 5895. Generally feeling bullish at the moment.
tmfp
exchange down
how did you manage to do that ?
lol not me, I wish.
I think there may be some very burnt fingers about, IG went 5 pt spread now back to normal.
As I said on other page, caught that 30 unwind scramble for a short, half out just now at 10, hoping for +60 today on balance.
Closed US may confuse matters, but would be surprised if 5800+ holds for very long.
Good morning all.
I wish I didnt close my LONGs on DAX & FTSE 100 last Friday.
I have an idea on FTSE 100 and I hope you all find it useful.
Have a good President Day….
back into Long on FTSE at 5791 stop 5720 target 5950
moving the SL to BE
first target moved to 5887
Morning all, just unwound the rest of single stocks so now completely flat on everything. The bulls seems to have got the bit between their teeth but am thinking that last time the couldn’t really get past 5900 and we’ve just had lower low (5500) so scale up short starting at around 5825, actually change that, small short at 5809. Here we go.
Whoops, went a bit early, looking for 30 to add.
Nice sellable bounce there chippy, unlucky on the near miss.
While the DAX chugs along in a shallow uptrend, it’s going to be a bit tedious and we could do with a lower low ie ~5800 or we might do the same, maybe towards new highs.
A break of 9200 or 9240 DAX will set the tone, but no more fireworks today methinks.
Added at 30, still small.
By the way, I agree, no more fireworks today. 300 point run when you couldn’t give it away on Thursday plus Dow having a day off. Going to be a bit like trading Sunday FTSE!
In case you hadn’t gathered, my sub 5800 master plan is out the window till this surreal nonsense shows signs of weakness, which it probably won’t with the DOW shut.
Still up for scale up medium term shorts should we reach 50 though, otherwise going with the flow, sniping off 80+ rsi for a half and half top pick/scalp as usual.
Like so, off 35 🙂
This RSI is a funny old game and I’m not sure I fully understand it. I’ve been playing with it at home during the evening on the DOW, because I can’t watch that closely during the day at work. Sometimes it seems obvious but others not. I have IG chart on 15 minute candles and rsi at the bottom on 3 mins, is that right?
So much for an early start dip to get long on! Agree that its probably come too far too fast on not much so needs a pull back. Looking at the 2 hour chart would suggest 5600 for a long entry but don’t think its going to get that low
We trade differently, so it means different things.
I’m glued to every tick all day, so my default approach for a relatively risk free/limited loss entry is extreme readings on the 1min 10 ie >80 = overbought and liable to pull back, or <20 = the reverse.
Off course it doesn't work all the time and should be used strictly in context. Trending days can muller you.
Also divergence between the rsi and the price can signal loss of momentum, like it just did on the one minute.
That 35 short was only a punt with a 6 point stop and I've just taken 14 on half of it, running the rest at b/e+5 (40) stop out of the profit on the scalp, so worst poss scenario is +9 and best is short at the top and running until newer highs are made.
Rinse and repeat.
Got it, thanks mate. Like I say, when playing with it at home on DOW it needs a bit of concentration but can see what you mean. I did look at 1 min for a while but it seemed too “sensitive”.
Yes Nick, looks like a low volume grinder, the sort of Monday where we look back on Thursday and think “WTF didn’t I short that?”
Indeed. Though I’ve just gone short at 5845 so with any luck…….
The main plus of rsi is it is a momentum indicator, so price levels are dynamic not fixed.
It’s momentum that breaks otherwise strong technical resistance.
Morning all,found Nick’s deliberate error,”5746 5700 5713 5689″.
Australia tried to resist the Bull a bit last night,there was a story about possible free money from Japan too fwiw.
Just testing WSF 🙂
🙂 happy to keep claiming the one pound Gift Vouchers,Boots or WH Smith,all the same to me.
tmfp
are you free for a chat ?
want to ask you a few Q. on your trading .
if that is ok with you
Sure
It’s strange how the DOW being closed has this effect on the preceding European session.
Reminds me of teenagers knowing their parents are out for the evening and doing naughty stuff.
Draghi is talking to the European Parliament at 14.00,so if that doesnt lead anywhere think I’ll go out too.
IG have got the DAX resistance tagged around 9240/50 and next stop 9400, sound about right to you WSF?
I’ve got 340,360 and 390 marked too,not sure why I did that although 339 was last weeks high so that might explain the 40.
I’ve stopped marking levels with degrees of importance so I have one list every day and dont write the reasons or what timeframe they are from unless it is a Doji pattern like the Evening Star on the weekly we are still 700 odd points below or something really significant.
Ok tks. Nothing much around here then?
9254 was the January low,might be what IG are looking at.300 as a round number,so I guess I should feel Bullish 🙂
BUYBUYBUY then, only 500 points off the lows, a reet bargain 😉
Here is Brenda Kelly’s view :
“Once again this upside relates to expectations that central banks will step in with additional stimulus. Given that markets were only temporarily satisfied with negative interest rates from the Bank of Japan, it’s difficult to see if the current move can be sustained given the lack of ammunition available.”
http://www.lcg.com/uk/analysis/#8528
She was on The Keiser Report 2 weeks ago.Seem to remember you mentioning her.
Hi tmfp
I as I am sure everybody else have read and enjoyed your posts.
from them you appear to use your RSI to give over-sold-bought area, and trade these accordingly.
Q1. the system as with any other system – works fine – when conditions of the market suit the system – how do you handle the “off ” times ?
Q2. you stated that the last couple of weeks – your short stratedgy was on hyperspeed . Supertrend & RSI system – ? Was it more to do with your ” bear ” mentality that was at work and you put your RSI in hibernation temporarily?
Q3. What is the usual ( forget the past few weeks ) – win to lose ratio with the RSI system?
Q4. How much more additional input – indicator – fundamental or gut-instinct plays a role in your trading?
I better stop before i get carried away
thanks anyway
paul
Ok.
1) The standard overbought/oversold levels go out the window on a trending day, but rsi is not solely a counter trend indicator. E.g. if there is a solid uptrend in force then dips to 40 can indicate a potential long entry. Reverse true with 60 in a bear run.
2) I try to prepare for the day’s trading based on what happened overnight and work out “what if” scenarios.
Eg Thursday morning, when I warned pre opening of that potential -100, that was based on what I thought of the market overall, with overnight setting up a scenario where the move looked likely. If I get in front and the market moves substantially with me, then I’ll chase it, selling bounces and moving my stop to average or better. Sometimes it’s good to go for the throat, with no risk of overall loss, because of a good original entry.
3) About 70% for scalping, but showing a profit and taking it are two different things.
4) I use fib to estimate the likely size of pullbacks/bounces, short term trend lines, resistance like double tops and bottoms and rsi mainly. I am in awe of Ichimoku clouds and other esoteric stuff but try to stick with stuff I understand.
There’s not much “gut instinct” because it’s so easy to get dogmatic about emotion based trading, people find it hard (and expensive) to admit they were wrong. I just blame the indicator and move on. 🙂
And you mentioning the stop word, I always use them. I find that a good entry will have a natural stop level which is financially and technically justifiable, otherwise it usually means that risk hasn’t been quantified properly.
Hope this helps.
tmfp
If I may continue for a little bit longer
Q5. You often say – ” short at 6820 – 6 either way ” – is there some logic in the “6” etc. or is it just what you are willing to risk?, whats the basis you calculate the stops?
Q6. In the opposite sense – How do you take profits? chart based or ” that’s too good to give back ”
Q7. Away from the charts – Do you use – other basis to trade – eg. Daily targets – set loss in £ before stop trading etc.
Q8. have you tried other methods to trade – eg. moving avg cross – and settled on RSI – any concrete preference for this?
Thanks again
5) That refers to the amount of stop I will allow before accepting the trade isn’t working out. I wor out risk first reward second. A <1:1 r/r trade is no trade at all, so once I've got the +6 I'll either take it, or run it and use that level as a profit protecting stop. 10ish pts is a good scalp profit.
6) I like taking profits that's why we're here. 🙂
In hindsight I do take them too early sometimes, but once a trade is over then I can go back in any time. Eg if I'm long at 35 and see resistance at 50 I'll take +15, but be quite happy to go back in long at 55 if I believe the breakthrough is real.
7) Nope, although three losses in a row, I usually time myself out for half and hour. Doesn't happen too often thankfully.
8) No. I like indicators which I can relate to actual trader mentality at that point in time, not a couple of obscure time frame EMA lines crossing or a random pivot breaking. They can be relevant if enough people trade them and thus influence the price, but that's arse about face thinking to me.
Very interesting Q and A from Paul and tmfp…….good stuff chaps.
anstel
ya! bit more interesting and more relevant than yellan or draghi ?
or maybe not!
Tell you what isn’t interesting is this market! I’m sitting watching it go from being 12 points wrong to being 22 points wrong and back again. That said, doing invoicing this afternoon which always cheers me up!
As a bull by nature I think we need another proper down leg with a higher low, this rise feels like its got sandy foundations. So I’ve talked myself into running it for a couple of days.
Nice little sell off into the close, roll on tomorrow. Cheers all 🙂
Cheers mate – sell off gets me to b/e. As you say, roll on tomorrow.
Be interesting to see if Europe drifts up tonight through the afternoon R in that interesting way the Dow does sometimes.