
Good morning. After that initial rise yesterday morning that failed to dip quite low enough to trigger my ideal entry at 7046, we spent the rest of the day hovering around the 7100 area. Coiled spring anyone? Even the ECB press conference failed to get prices moving much, and you know its a quiet day when the main thing everyone talks about is a protestor leaping the stage during it! There has been a slew of not so good data recently and the markets have held up pretty well despite it, so pretty resilient and further upside to come? The European Central Bank said it remained committed to its full asset-buying programme to revive the euro zone economy.
US & Asia Overnight from Bloomberg
Asian stocks rose, with the regional benchmark rebounding to it highest since May 2008, as materials companies and energy producers led gains.
The MSCI Asia Pacific Index added 0.7 percent to 153.70 as of 11:08 a.m. in Tokyo. The 14-day Relative Strength Index on the Asian regional index was at 75.8 today, trading for a seventh day above 70, a level some traders take as a signal stocks are poised to drop.
“A lot of funds having been underweight and hence will have to pay catch-up” with the recent gains in regional benchmarks, said Andrew Sullivan, head of sales trading at Haitong International Securities Group in Hong Kong. “Some people have been so bearish that they can’t believe things can turn positive.”
Hong Kong’s Hang Seng Index, among the world’s biggest advancers this month, added 0.2 percent. China’s Shanghai Composite Index rose 0.8 percent, taking its 12-month surge to 96 percent. Japan’s Topix index slid 0.1 percent.
New Zealand’s NZX 50 Index climbed 0.2 percent, and Australia’s S&P/ASX 200 Index rose 0.6 percent. South Korea’s Kospi index gained 0.4 percent,
The MSCI Asia Pacific Index halted a nine-day advance on Wednesday, its longest winning steak since December 2013, after data showed China’s economy posted the slowest economic growth in six years.
E-mini futures on the Standard & Poor’s 500 Index were little changed. The underlying gauge rose 0.5 percent on Wednesday in New York, to within 0.5 percent of its record, as Intel Corp. climbed and energy companies rallied with oil reaching a 2015 high.
U.S. Data
U.S. industrial output slipped more than economists had projected in March, with the Federal Reserve examining data to determine the best time to raise benchmark borrowing costs.
The central bank won’t move to raise rates until December, according to a Morgan Stanley index. A month ago, traders were pricing in an increase in September, the gauge showed.
Fed Chair Janet Yellen has said that while rates will probably rise this year, any decision depends on economic data, with recent releases missing projections by the most in six years. [Ref]
FTSE Outlook
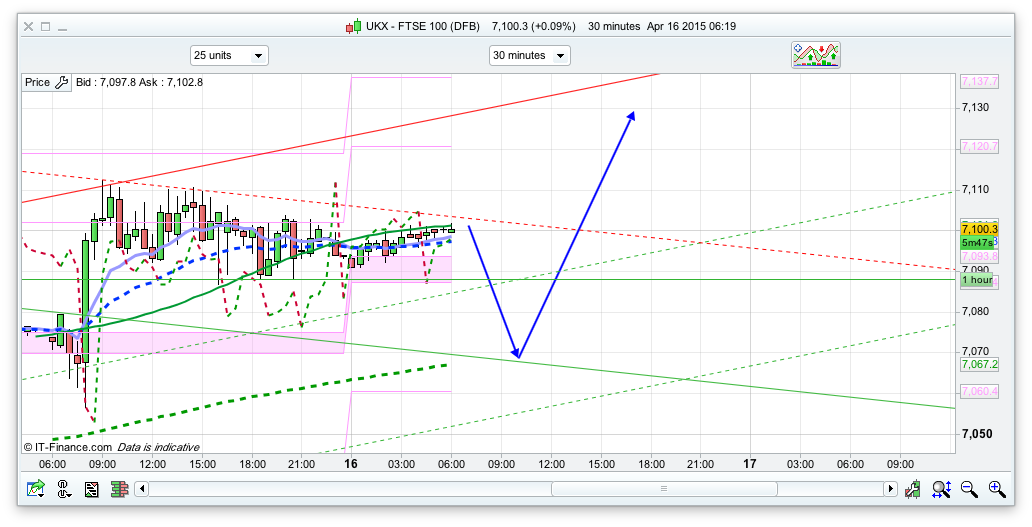
The FTSE continues to hold up pretty well all things considered and that will probably be the case today. We have the bottom of the 10 day Bianca and the daily pivot at 7088/7087 respectively, so there is potentially pretty good support here, and a break of this would lead to the 200ema on the 30min at 7067 – which would be a good point for a bounce (or just above). Below this there is the bottom of the rising 30minute channel with support at 7055. If these support areas hold then I think we will break through this 7100 ceiling area on the next push and test the 7130 and the top of the 30 minute channel. The momentum is with the bulls at the moment, and the bottom of the daily 10 Raff (7076) and Bianca channels is likely to hold, generally speaking. If they break then a dip down to 6980 is going to be plan B.
Resistance wise, 7113 initially, being yesterdays high, then the 7130 area where we have the top of the 30 minute channel as mentioned. Above this 7160 and 7195 where we have the top of the 20 day Bianca channel. 7231 if it went bonkers for the top of the 10 day Bianca.
Good call on the 67 bounce Nick.
Cheers. Went in at 7073. Naughty pre opening move there to take out the stops.
Its often worth doing (certainly on IG anyway) the opposite to the 07:55 – 08:00 price movement.
Yes, agree with you there, very nearly shorted that 20+ move but lack of bottle.
The “what if” factor, especially on the upside these days, makes me a bit wary pre market but the current long periods of inactivity (like now) put the pressure people like me who need to earn points every day, to take the volatility while it’s there.
Nick is slightly too optimistic as usual. Markets crashing.
Not really! I shorted that stop killing spike at 7123, closed, went long at 7073, closed at 7093 and did pretty well today, all done pretty much by lunchtime!
And the EMAs are now short from 7093 but only took a few points off that
Lucky you, how did you even get that spike…Wow, good you closed that 73. I tried long 18035 but I think I went too early so closed +1.5 when things went wrong. Don’t think it’s worth risking now at this spread. I will see how 18005 will play out if it gets there.
EMA are short, it puts me off longs at the moment, but missed all morning short thinking of other things.
Oh, and a cheeky dax short off the pivot at 12245 that was rather good 🙂
Stop showing off 😉
ha ha!
This 200ema area at 7067 acting as good support so far… might get 7055 though?
Just rsi shorted at 90, bit wary of the usual US opening run up though…
Yep, should have held 35.
Nearly back to 67 for a third test.
I think it will hold as it will coincide with mildly oversold 3m rsi and the start of the last official ftse hour, so I’ll be covering soon, maybe take a little long for good luck.
I doubt it will break 18106, but on other hand I want to believe in that, not sure why? It kind of stalled, but it may go up? What do you think?
Germany pushing down, FTSE pushing down, I am not going long on Dow. Just came back and noticed 18107.5 is holding at the moment. I am not risking for break out today.
do we think we will see FTSE below 7000 again any time soon?????
I cant see how it can keep rising with all that’s going against it
It will drop, the tough question is when…………..
I reckon there’s a meltdown 48 hours coming all round, probably Greece inspired, the problem as you say is when….
I think you may be right, it is looking for an excuse to drop through the floor………
And another good call @ 55 Nick, you were on fire today, long may it continue 🙂
“Zigzagger says:
April 8, 2015 at 11:15 am
… I do fancy a (pre-election) short if we get to a high around 18th April. Might be around 7100-7125 by then. There’s a nice daily gap below at 6850 that’s waiting to be hit sometime …”
I should have set a limit to short at 7125, but was out today so didn’t want to risk it. Need to see how tomorrow plays out (it’s Opex ) so there might be some bullish last gasps but today in my view was definitely the first chink in the bulls armour. The stage looks set for a possible decline starting next week. Those gaps below at 7015 and 6850 should be starting to beckon. Fantastic example of an exhaustion spike first thing.
Can’t rule out sideways move / retest of the high next week but the election is going to start concentrating people’s minds now. If Grexit fever doesn’t take hold then surely profit taking will?
Hi all,
Newbie here. I’ve been lurking but read Nicks report and your comments with real interest today.
I was wondering; can you explain the stop spike which occurred on the FTSE on IG? How does that occur? Nick, how did you know it wasn’t a sign to buy?
Thanks 🙂
Hi Lozza,
There were some clues. It’s a zone of trend line resistance on the daily chart around 7125, plus it’s also a Fibonnacci target from the low on 1 April, so a reasonable bet that it might stall around there. Of course we had a very similar opening the day before which didn’t stop until it got to 7012. How can you tell? The only true confirmation of it being a possible top was a break below the base of the climb which started at about 7095. 7096 was the closing price the day before and while it doesn’t have to hit it, it quite often does, so the odds favoured a short from there, but it wasn’t a sure bet thing. I expect Nick will have his own views, but I hope this helps.
Great, thanks Zigzagger