
Good morning. Well that was a rather bullish day, a bit more than expected as we didn’t even get an initial dip very far, only managing 6847 before rising to test a high at 6960. There was a little dip at the end of the day, but I think the bullishness will continue for a little while longer. There is a pretty decent rising trendily on the 30 minute chart in play at the moment, and we are just nosing above the 10 day Bianca channel. Equity markets around the world certainly shook off the bad news regarding NFP and Greece worries yesterday, while the Fed’s Kocherlakota stated that the Fed could resume QE if the slowdown in the economy continues whilst the ECB’s Mersch commented that the ECB may change the pace of QE buying if inflation goes above expectations.
US & Asia Overnight from Bloomberg
Asian stocks climbed toward a nine-month high, led by Hong Kong shares, and the dollar weakened as the Bank of Japan kept policy unchanged before the Federal Reserve releases minutes of its March meeting. Crude oil fell ahead of U.S. inventory data.
The MSCI Asia Pacific Index rose 0.8 percent by 12:52 p.m. in Tokyo as the Hang Seng Index advanced to an almost six-year high. Standard & Poor’s 500 Index futures fluctuated after the gauge dropped in the last 30 minutes of U.S. trading. The Bloomberg Dollar Spot Index slipped 0.2 percent after its biggest back-to-back gain in four weeks. The yen strengthened 0.2 percent to 120.06 to the greenback. Oil in New York fell for the first time in three days.
Hong Kong shares are surging after their Chinese peers extended a world-beating rally amid further indications of government support for the equity market. The Bank of Japan maintained its record stimulus Wednesday, while minutes of the Fed’s March meeting may offer insight on the timing of U.S. rate rises. Analysts project an increase in record U.S. crude stockpiles.
“It’s a bit of a risk-on move, with global equities up in this bad-is-good, central-bank dominated marketplace, where bad economic numbers means we’ll be Fed-accommodative,” said Larry Milstein, managing director in New York of government-debt trading at R.W. Pressprich & Co. “Psychologically, there’s a fear that the Fed’s going to start a tightening cycle.”
October Bets
The Asia-Pacific stock gauge is heading for its highest close since June. All 10 industry groups have advanced this year, with the recent surge in oil helping a subindex of energy shares to reverse a first-quarter slump.
The Hang Seng Index jumped 2.4 percent, the most since May, amid volume three times the 30-day average for the time of day. The city’s benchmark gauge is trading at its highest level since May 2008. A gauge of Chinese companies listed in the city surged 4 percent, with none of the 40 member stocks retreating. Buying of Hong Kong shares by mainland investors via a link with the Shanghai bourse increased to a record.
The Shanghai Composite Index fluctuated after briefly rising to a level that was double its 2014 low. China needs strong support from the stock market as its economy faces relatively large pressure this year, the official Xinhua News Agency said in an article Tuesday.
Japan’s Topix index advanced a second day and was set for its highest close since March 25. The yen was 0.2 percent stronger after losing as much as 0.8 percent to 120.45 per dollar Tuesday, its weakest intraday level since March 20.
BOJ Easing?
The BOJ kept to its plan to expand the monetary base at an annual pace of 80 trillion yen ($666 billion), as forecast by all 34 economists in a Bloomberg News survey. The BOJ is among a wave of central banks easing policy to stave off deflation and ignite growth. By contrast, the Fed has ended its bond-buying program and is pondering its first rate increase since 2006.
The S&P/ASX 100 Index climbed 0.3 percent in Sydney, while the Kospi index in Seoul was up 0.5 percent Wednesday.
The Bloomberg dollar gauge, which tracks the U.S. currency against 10 major peers, climbed 0.9 percent the past two days. The euro added 0.2 percent to $1.0837 following a 1 percent decline Tuesday.
West Texas Intermediate crude slipped 1.9 percent to $52.94 a barrel after surging almost 10 percent the past two days and settling at a 2015 high on Tuesday. Brent decreased 1.5 percent to $58.23 in London.
U.S. crude inventories probably rose by 3.25 million barrels through April 3 for a 13th week of gains, according to a Bloomberg survey before an Energy Information Administration report due Wednesday. Supplies increased by 12.2 million barrels, industry data showed Tuesday, according to a person familiar with the figures who asked not to be identified.
Royal Dutch Shell Plc is in talks to buy BG Group Plc in a deal to bolster its position in the global gas-export industry. BG confirmed the discussions in a statement late Tuesday, stating there was no certainty that an offer will ultimately be forthcoming. [Ref]
FTSE Outlook
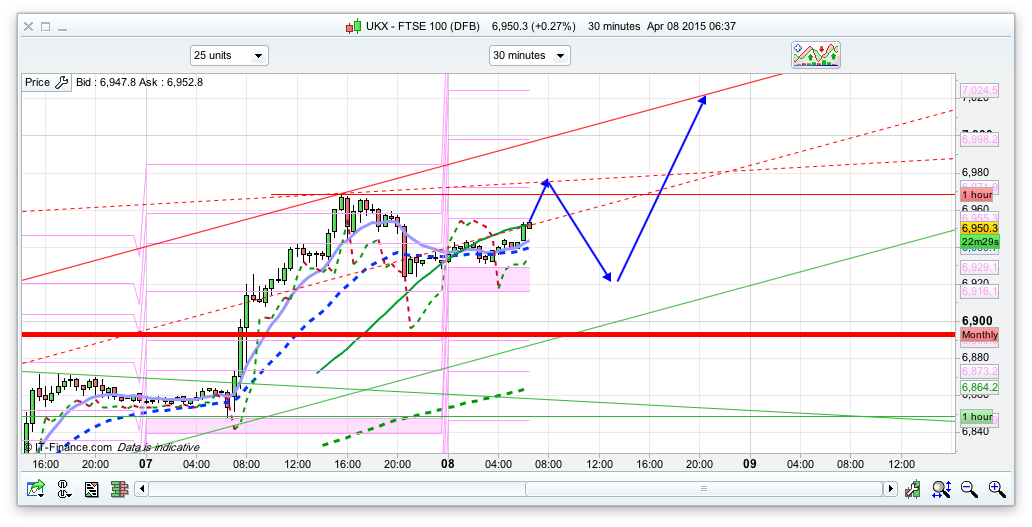
For the moment it looks bullish still, as we are just nosing above the 10 day Bainca channel as I am writing this, at 6942. There was a little dip last night of 30 at the US close, most of which has been regained overnight. Todays pivot is 6915, and initial resistance (if this breaks above the 6950 Bianca resistance keeps going) is yesterdays high at 6970. Followed by the top of that 30minute channel and the fib pivot area at 6998. If the bulls manage to break 7000 again then the next levels to watch are 7025 and 7075. I think we will get an initial dip today down towards the pivot area at 6915, before an assault on the higher levels, based mainly on the fact that the bulls got a bit exhausted yesterday despite the momentum that carried a 100 point rise. Going to be an interesting session anyway! Below the pivot, the support level is 6888, 6878 and with 6850 below that. The daily EMAs are turning to bull again (can’t really make up its mind what it wants to do!) with the 10 rising above the 25, and indicating the start of a rise, though the top of the Raffs are 7020 and 7045 (10 and 20 day respectively) so a few resistance levels coming up. I think buying a dip down to the pivot will be a good strategy for today.
In the words of buzz lightyear… Reach for the Sky. +7k again
I know some traders follow the influence of the full moon and new moon on the markets. The theory goes that highs tend to cluster around new moons and lows appear around full moons. The attached FTSE chart lists the full moons / new moons going back to the beginning of 2014. While it is not a 100% (what is?!) and there are of course exceptions I thought it was curious that highs did tend to appear around a new moon and lows around a full moon. Of the last 16 full moon / new moon cycles the ftse was higher at 11 of the new moons than the previous full moon. Make of it what you will but I’m curious to see if we’re going to put in a high ‘around’ the next new moon on 18th April.
http://s172.photobucket.com/user/zigzagger2/media/FTSE%20Moon%20chart%202014-15_zpsfhq1bnsy.png.html?filters%5Buser%5D=142860610&filters%5Brecent%5D=1&sort=1&o=0
Cheers Zigzagger, I have also heard the weather plays a part – FTSE more subdued/bearish on rubbish weather days, bit more bullish on sunny ones!
Do I sense just a smidgen of cynicism there (!) … well I was asking/expecting to be ridiculed, but 66% odds is better than 50:50 and it is curious that we zoomed up from the last full moon on 4th April and down from the new moon prior to that on 20th March. I’ll go away and howl in my corner …
Not at all…. I think all that stuff plays a part, stars, moon etc
Ah – a fellow astro trader at heart! Just putting my logical rational head on for a moment – we know that markets move in cycles, so it makes sense that there might be a link with other cycles that are going on out there. It did at least stop me being too much of a bear after the NFP sell-off. Just wasn’t brave enough to go long before Easter though. I do fancy a (pre-election) short if we get to a high around 18th April. Might be around 7100-7125 by then. There’s a nice daily gap below at 6850 that’s waiting to be hit sometime.
Nick, does it mean no retrace to 6970? It’s just too narrow flatted. Especially Dow concerns me. Once again it broke above 17869 and even bounced off it while I was sleeping. I think nothing will happen until US open. Maybe it will drop on the open for a chance to decide: up or down (prefer up). Enjoy the sunshine.
Gosh, these children drive me mad. Took long 17872 but instead of holding as I planned they jump on me: Tesco Tesco Tesco, I had to go to Tesco of course closed with only 3.5 points. Just hate hols. Sometimes I think, oh on hols I will trade, there will be no school runs, no, it’s not possible either. now making a cake time and market does a runner.
40 of this rise to 7000 is purely due to Shell/BG
so this goes back to 6960 now 🙂
Long @ 6960
gone with the wind. anyone long?
I got burnt twice long on the way down before I twigged the lack of buying support, so I switched round to short at 60 and just covered at 37, made most of it back
🙁
Wish I’d stayed in Spain…
Atleast you covered, not me 🙁
I hate this week so far
What a weird day! Shame it didn’t quite reach 7025. Not good (for the bulls) that they couldn’t hold above 7000
There’s better support at 6930-40. Watching the reaction into the close.
I’m still trying to work out what we’re doing over 6900 in the first place…..
Short at 46 looking for a few points into the close.
Fed’s Dudley says June rate hike still in play.. more fall, may be to the place this bounce started from 6680 overnight low on 1st April
Took 14 points which gives me ONE point nett profit on the day and I worked bloody hard for it.
I hate the way the market hangs on every word these people say, reminds me of waiting for the different coloured smoke when they elect a pope.
Free markets? What a joke.
This Central Bank meddling will bite them in the a*rse bigtime one day.
Hi everyone, hope this week is going great everyone. just wanted to ask your opinion if this is just retracement for last week or getting into selling trend?
wait for FOMC minutes reaction after 19:00 GMT today
weird, OK long at 14.30 set off fine, I would have gone long there as it’s my set up. OH, something happening. Short?
it looks like short a bit, but scary to do short, it may be a bounce off 17856.. anyone wants short?
missed 82, ai,
gone then gone, I didn’t plan to trade late in the day, just wanted to have a look.
market maker is playing evening football. it’s untradeable set up for me. actually 17820 was some level which I forgot about.
Jack, leave it for today.
I think you are right. I don’t see any long developing, so came out b/e.
Don’t like the look of the 4-hourly chart. Pipe top pattern (same length green and red bar) with a hanging man in the middle. It can of course be easily negated with a rise above 7012, but has the potential of becoming a head and shoulders targeting coincidentally 6850 where there’s a daily gap to fill. We shall see …. FTSE feels at the moment as though it’s a challenge to hold above 7000 for any length of time.