
FTSE 100 Support 6995 6973 6957 6940 6939 6912
FTSE 100 Resistance 7043 7055 7072
Good morning. Was a bit more bullish than I expected yesterday managing to rise to 7030 off the back of the increased inflation news… sterling strengthened a bit as well, back up to the 123 area against the dollar for the moment. Higher prices for clothing, particularly womenswear, hotel stays, restaurants, petrol and gas pushed the UK consumer price index up to 1pc in the year to September, compared with a 0.6pc rise in the year to August. The inflation figure is higher than the 0.9pc rise widely expected by the City and is the highest rate of growth since November 2014.
The FTSE 100 did fall back from the 7030 area though the bulls managed to hold that 7000 area overnight, even with the China news showing a slowdown in industrial output. We have the 10 day Bianca channel for initial resistance at 7055 – these channels seem to be working again so a tentative short here for a run down to 6975 or lower looks worth a go.
US & Asia Overnight from Bloomberg
A touch of caution was evident in financial markets after a slew of Chinese data that largely painted a picture of stabilization in the world’s second-biggest economy.
The MSCI Asia Pacific Index and the Australian dollar trimmed gains as an unexpected slowdown in China’s industrial output cast a cloud over gross domestic product figures that matched estimates. Hong Kong’s Hang Seng Index swung to a loss and the Shanghai Composite Index surrendered the bulk of its advance. A gauge of the greenback’s strength held near its lowest level in more than a week following U.S. inflation data that damped expectations for interest-rate hikes. Oil rose after data showed American supplies fell.
A stabilizing Chinese economy has helped bolster investor sentiment since January, when a tumbling yuan and signs of a slowdown spurred selloffs in global equities and commodities. While Wednesday’s data was nothing to shout about, it provides some reassurance as the Federal Reserve weighs the case for its first interest-rate hike since December. The probability of borrowing costs being increased this year slipped by three percentage points to 63 percent on Tuesday as core U.S. inflation fell short of estimates.
“China won’t do anything new in terms of policy because the economy isn’t sliding,” said Ben Kwong, a Hong Kong-based director at KGI Asia Ltd. “Under these conditions, the market doesn’t really have a direction. It needs to wait for news on U.S. rates.”
Stocks
The MSCI Asia Pacific Index added 0.3 percent as of 12:38 p.m. Tokyo time, having been up 0.4 percent prior to the China data. The Hang Seng Index declined 0.2 percent and a gauge of Chinese companies’ Hong Kong-listed shares fell 0.4 percent. The Shanghai Composite was up 0.1 percent.
Sharp Corp. surged as much as 11 percent in Tokyo after Nikkei reported that the company expects to achieve an annual operating profit for the first time in three years. Betting company Tatts Group Ltd. jumped 16 percent in Sydney after agreeing to be bought by Tabcorp Holdings Ltd. in a deal valued at A$6.4 billion ($4.9 billion). Tabcorp rose 2 percent.
Futures on the S&P 500 Index added 0.1 percent after the U.S. benchmark climbed 0.6 percent from a one-month low in the last session. Goldman Sachs Group Inc. gained 2.2 percent on Tuesday after posting a 47 percent increase in earnings, while Netflix Inc. surged 19 percent after reporting a jump in subscribers. While only 57 S&P 500 members have reported results so far, 83 percent announced earnings that exceeded analysts’ estimates, according to data compiled by Bloomberg.
Currencies
The Bloomberg Dollar Spot Index, which tracks the greenback against 10 major peers, declined less than 0.1 percent. The gauge has advanced this month amid speculation the Fed was getting closer to a rate hike, prompting hedge funds and money managers to boost net bullish bets.
Australia’s dollar was up 0.1 percent, after earlier strengthening as much as 0.3 percent. New Zealand’s currency was up 0.3 percent, having recorded a gain of 0.6 percent in the run-up to the Chinese data. Both countries count China as their biggest export market.
“If the Aussie and Kiwi are looking for fresh fuel, they didn’t find it in the China data,” said Sean Callow, a senior strategist at Westpac Banking Corp. in Sydney.
Bonds
Australia’s 10-year bonds gained for the first time in four days, pushing their yield three basis points lower to 2.31 percent. The rate on similar-maturity U.S. Treasuries was little changed at 1.74 percent, having fallen three basis points on Tuesday as core inflation, which excludes energy and food costs, came in weaker than economists estimated.
Commodities
West Texas Intermediate crude climbed 1 percent to $50.78 a barrel in New York. U.S. oil stockpiles dropped by 3.8 million barrels last week, the American Petroleum Institute was said to have reported. Analysts surveyed by Bloomberg forecast official data on Wednesday would show an increase in supplies. Oil has risen about 14 percent since OPEC reached a deal to manage supply last month.
Gold added 0.1 percent, gaining for a third day. Aluminum rose 0.2 percent in London, while copper was down 0.1 percent. [Bloomberg]
FTSE 100 Outlook and Prediction
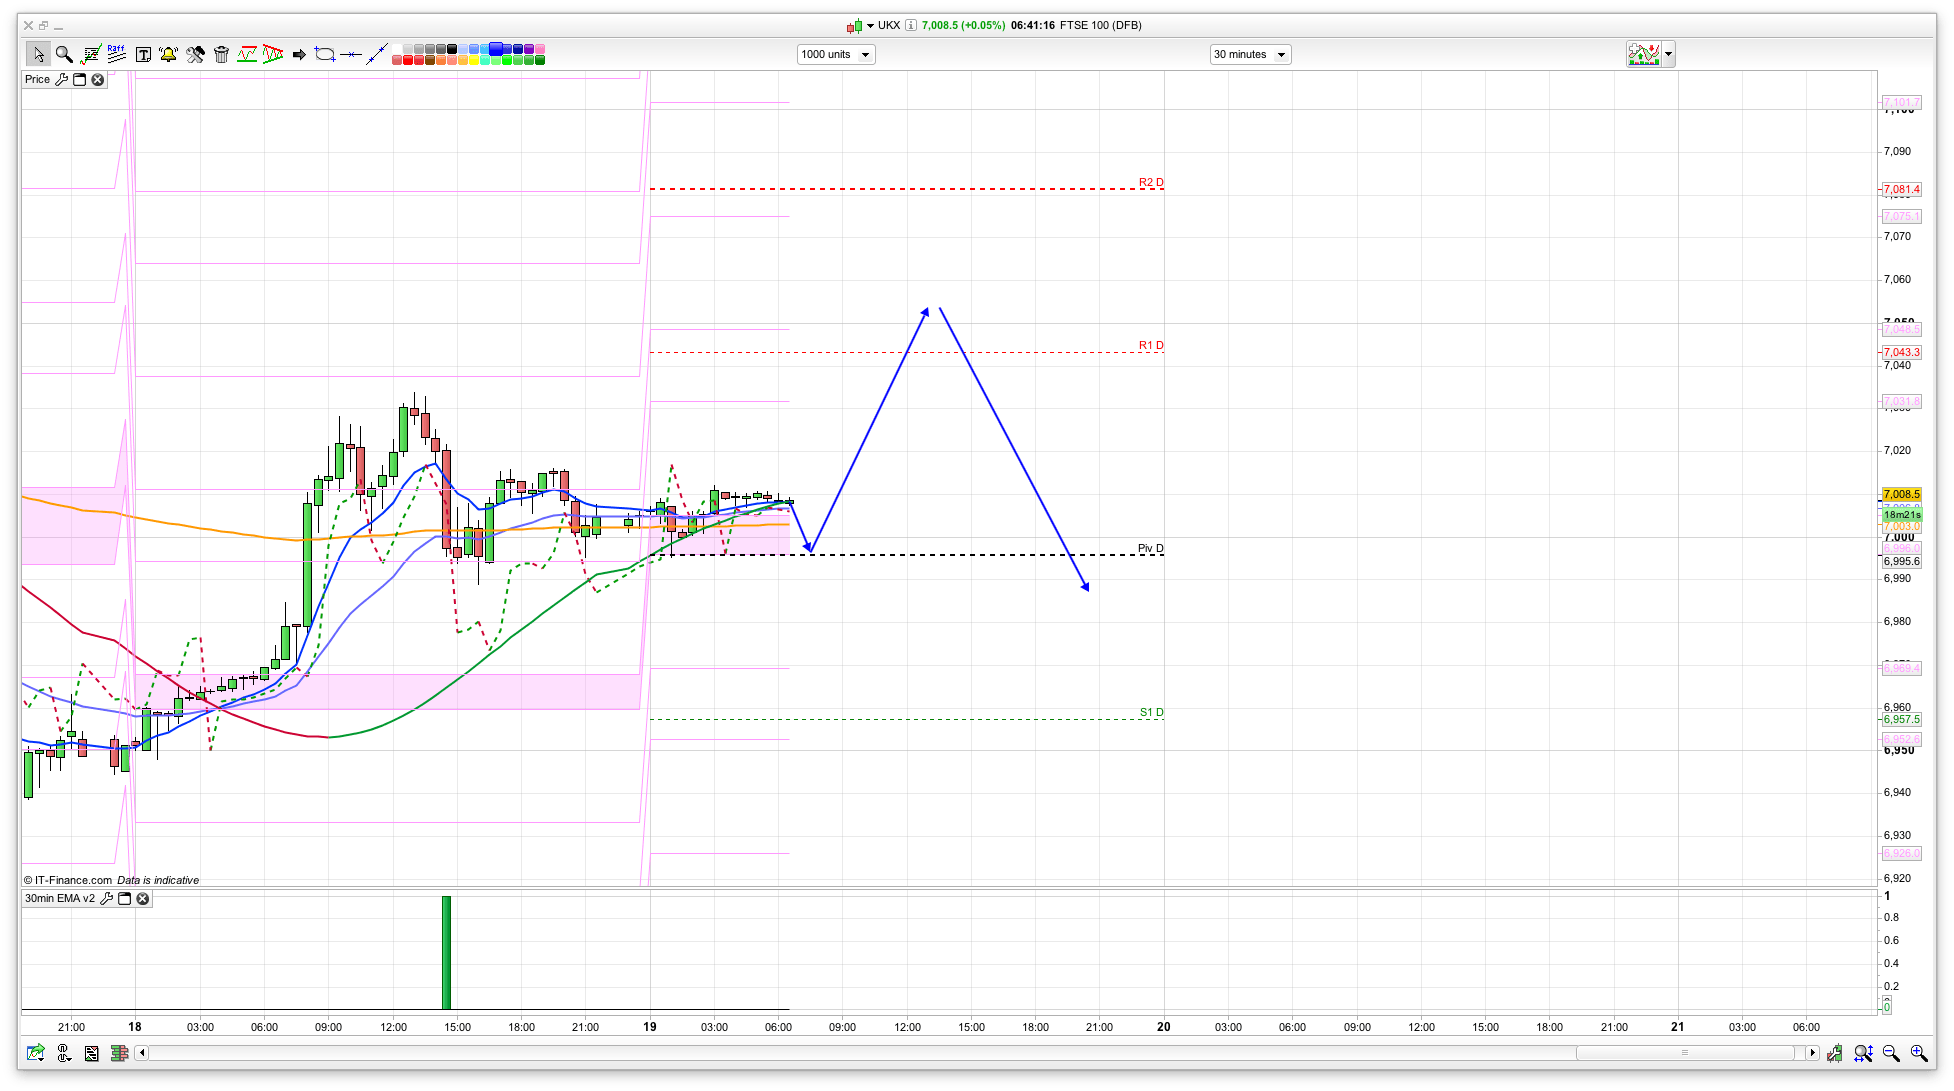
I am still in a short the rallies frame of mind, with 7055 looking a good level to enter, if the FTSE 100 was to to get that high. We have the 10 day Bianca channel here, though the 10 day Raff channel is just above at 7070. For the bulls, we have support on a bullish 2 hour chart now at 6973, so this area looks worth a long, though if broken then I am expecting a trip to 6900 and maybe lower. We have tested the supports a few times now and bounced back well (from 6930 the other day) which is showing that the bears have power to drive it lower, whilst the bulls are desperate to keep it above 7000. As with the last few weeks a lot will depend on sterling also.
So, fairly simple plan today, looking at 7055 for resistance and 6973 for support. FTSE divi is 8.7 as well, so might well see some buyers come in during the last 30min of the day at 16:00.
Morning.
Good shout on the 70’s support Nick, it’s dead but it won’t lie down.
Lower highs and third time for 6940 coming up soon I reckon, with 7000 now a target for the bulls to break.
FTSE looking the strongest out of the indexes…yesterday’s uptrend still until 6940 broken…
so would you go long here?
I’m short from 7031 and 7010…
wheres your stop
i went long
What time period is that uptrend George?
I have the daily one broken last Thursday at 7040.
On the daily chart…
Yeah I see that I guess. That’s if you take the tails into account, personally I go for open/close candle bodies.
2mins trying to bounce again, but looking weak. 15mins rather bearish . . .
Short @ 6986.
what do you see?
Aborted for peanuts! 2mins still struggling to rise – let’s see if it can break above 6989.
Closed my short from 7010 this morning @6978! Still feel like more bearish all the way to 6940-60! Will be looking to buy there for some dividend later in the day ! Good luck folks
great trade
Gold breaking out of that 1250/1262 range finally!
ya got a long on gold
I am long from 1353. I’m looking for 1380 ish over next few days
I have longs at 1250 as well. Tucked in the bottom drawer for now, aiming for 1500
You Gold bug you
🙂 Only if it works out!
Should go to 1800 by december
This dodgy looking rally off the 75 low has broken the micro downtrend, needs to get above 90 to neutralise things.
Temporary? higher low at 80, first time for two hours. Trade 80/90 breakout I guess.
Struggling but getting through, looking for big exhaustion candle for a high 90’s short.
Gold rising today is the precursor so should start selling off hard tomorrow
You read it here first folks! 🙂
Or maybe this afternoon?
Divi might keep it up today though?
Possibly, but I think the DOW will find it difficult again to make an opening rally stick and that might lead to a weak couple of hours.
Depends what we do till then, the 90’s look a bit too far atm.
Say 80ish at 14.30, a quick -100 would set the old moggie amongst the flying rats…..
Made a right pig’s ear of that, ended up with an underwater short and paying the divi.
See how the DOW closes.
Nick…Is that gold selling off or the markets
Indices I meant. So FTSE might dip from this 7000 area to sub 6900?
ya agree with you probably even to 6850
Hi chaps, what’s the FTSE divi adjustment..9pts I think but not sure?
Argh just read your note above. Thanks
Manage to climb on the rally bus from stop no@6986! Should I hold for divi rally ? Will there be one ? Let’s see
good entry – should go to 7040 atleast
FTSE – 1250 ticks Could still go bear–shaped, but ROC Total Price in this setup has turned positive.
Anyone use tick charts? ProRealTime says they are great, but for some reason doesn’t make them available to ProScreener. ‘Why not?’ I wonder. 😀 Any ideas?
https://ee.md.it-finance.com/ProRealTime_V10_2/display_chartimage.phtml?name=ey7b6c7u089lmjgkbgjnanmt8&type=png&purpose=file
PRT extols tick charts —
https://www.prorealtime.com/en/x-tick-charts
looks good
jim
your charts are great to look at
are you able to trade off them?
you seem to have many types,
which do you use?
i was also experimenting all types of bars – volume bars/ tick / line / kagi / point & figure / renko / with loads of charts & indicators
got myserlf in a twist and paralysed unable to trade
i think the really thing that works is support & resistance
Hi JSft,
Thanks. I do use them for trading, but I hasten to add I am not the world’s greatest spreadbetter! Two different processes are involved; working up ideas to help with analysis, and then using the product to good effect. Problem is the latest idea tends to lead to neglect in exploiting the previous one! I am consciously trying to concentrate more on actual trading. 🙂
jim
just my experience for you to peruse
i spent nearly 5 years trying all combinations of charts & indicators. they were 100% accurate with one clause – “Only after the event”.
essentially all indicators work – in the “correct” market which it has been biased on. similarly with type of charts – minutes/seconds kagi/ tiks / renko or p&f.
The only thing that is not dependent on the correct type of market is – support & resistance – which is essentially buyers & sellers.
its only when i realised this I turned the corner.
I am sure that most here in this chat room use this method in one way or the other.
this is my experiance
I’m going to get my crystal ball out again at 2.30 – do the opposite to me to make money 🙂
Thanks Si you are my hero :0)
I’m going short on dow and ftse #crystalball
They will come down, oh yes.
Any moment now!
Longs will be *crushed*
Added @92
Thought it was a good idea to short at 7002, looks like I may have to pay the divi.
Looks like I wont pay the divi, cut and run at 09!!
Beware of bear trap folks ! Can go some good north from here ! Let’s see once it passes 3 hr resistance @7035, I might leave it till tomorrow ! Fingers cross ! 43 initial target
yes – this is where i see it as well
30 mins just got. Bullish I hope dun f**k this lol
Is there any reason why we are expecting big drop today even after bells ? All info appreciated
Yes! Because my crystal ball said so 🙂
Fair enough ! I have got my own crystal balls to trust !
One thing I like about here is even though one might not be the part of conversation but still can learn from others points.
Only thing we need ftse to pass 50 and form a candle of 3 hrs in my thinking to be good crazy Friday tomorrow ! Rest assured .. time for walk!!
love reading the chat in here even though am only small time player , trading can be a lonely game and this room certainly helps !!
This divi div; what’s happening with it?
Any ideas?
Short from 20, or does it go up to 50 in abit?
R1 is still on it seems
Long Closed @32!! short from 30 target 007