
26th January 2017
FTSE 100 Support 7176 7173 7153 7120 7111 7070
FTSE 100 Resistance 7181 7195 7199 7229 7260 7305 7364
Good morning. A bit of a lacklustre day on the FTSE 100 yesterday considering that we had the Dow break 20,000 for the first time, and the SP make a new high at 2299 (now at 2303!), whilst the Dax continued to climb. The Brexit vote, as well as the GBP/USD (cable) rate weighing on the FTSE yesterday. There was a brief bit of excitement as it dropped from the 10 day Bianca at 6204 to test 7170 where is then stayed for most of the day. Gold continued to decline, and has dropped off further overnight to dip below $1200. I think we can say that the Trump rally has resumed in the US though, and the Dow is likely to pop up a bit higher (had mentioned 20200 previously) to do over the shorters that piled in at 20000 (probably mostly retail).
FTSE 100 Outlook and Prediction
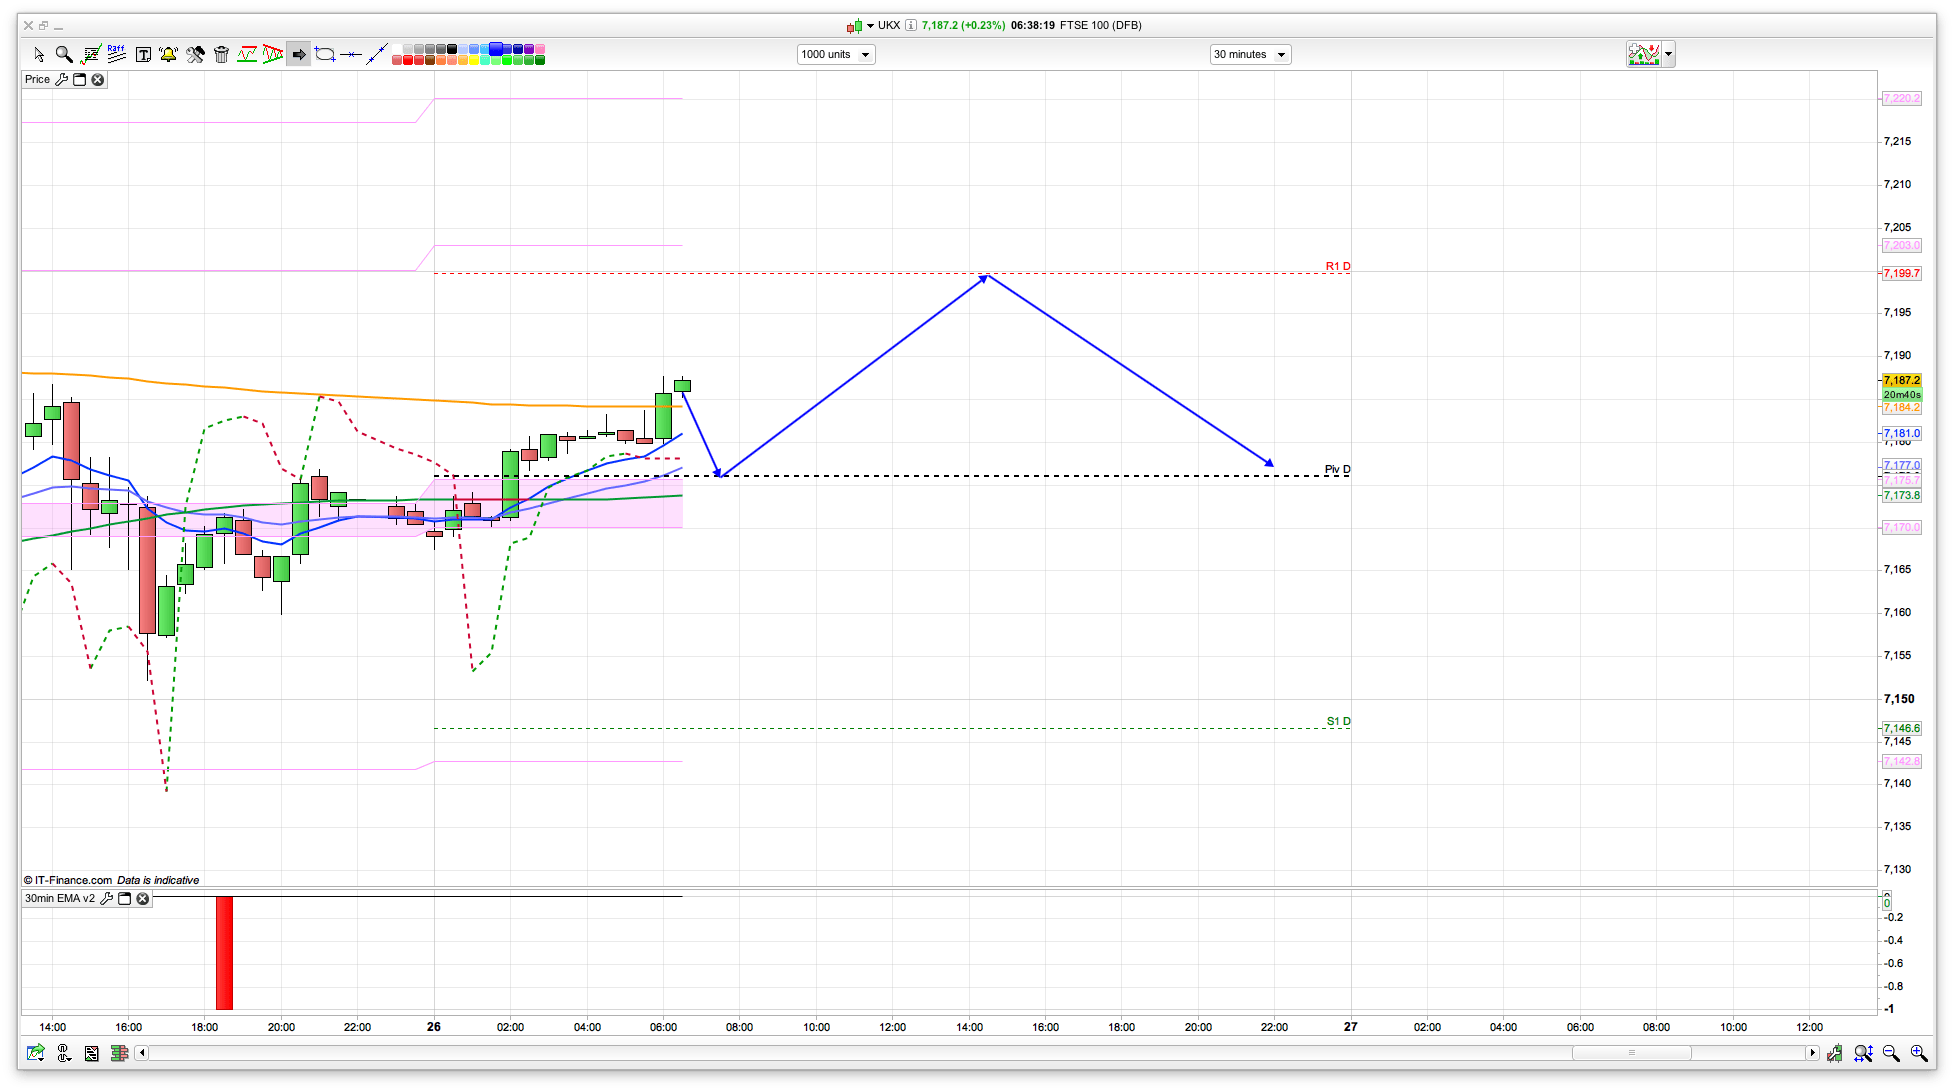
For today I think the other indices will push higher again, whilst the FTSE drags its heels. It is concerned about a “soft” Brexit following that vote (though the Dax/Germany prefers this), and also has cable rising above 12600 to temper any FTSE 100 bullishness. As such, we might well climb towards the 10 day Raff channel (and R1) at 7195/7200 before a drop back to the pivot (we dropped back from the 10 day Bianca yesterday so there is some bear power at these daily channels). Above 7200 then we have 7229, but the bulls will really need to break 7260 this week to reverse the bearish overtones on the FTSE.
Support wise today, we have the pivot initially, at 7176, with 7146 below this for S1. 7111 sees the bottom of the 20 day Bianca channel, with 7070 lower down. If we were to close below 7145 then I think we will see this lower support. So far the bulls have defined 7145.
I don’t want to fall to in love with the upside as the Dax and S&P are both at the top of their Raff channels, along with the FTSE at its 10 day. We are also testing or above the top of the Bianca channels on all 3 as well. RSI(10) is also above 70 on both of them (and the Dow). Breaking out but likely to get a dip back to retest if the pattern plays out.
I’m looking at a rising wedge in cable (supposedly bearish) rising off the recent 1.20 lows on the 4hr. Popped up above the upper trendline yesterday and now falling back inside. Hoping this is an exhaustion sign. I’m riding a long dollar yen from last night which is fast approaching my target trendline marking the falling highs on the hourly. Think I’ll just move stop up and let it have a go at punching through the line before killing it. If it does it would certainly mark a turn in the dollar retracement.
Getting quite bored and uncomfortable looking at my FTSE longs though. The rising hourly channel really isn’t a positive sign. If it wasn’t for the other indices moving up, I’d be getting worried about it.
More aimless wandering about by the look of it.
Only in hindsight will we be able to define whether this is consolidation or a slow mo dead cat. Still in a bull market though 7000 looks very inviting.
I’ve done four trades so far, rsi based, longed twice in the 60’s, shorted once in the 80’s and reaped a grand reward of 12 points.
Thinking about longing the possible break up through 84 should it come soon.
Think the FTSE needs a shot of something!
Humane killer.
A patient trader is a profitable trader……..off to walk the dog again….
Picked up a little on that sell off to 50 and out at 59, pondering a closing short.
Stopped pondering when I saw the gapped 1 min candles over 60, taken half short out for +5 running rest b/e.
Another day on the back foot for the FTSE, unlike our splendid T20 side.
match wasgood ..