
15th August 2017
Spaces available – Next Workshop Seminar 7th September 2017 London Heathrow – please click here
We got a bit of a bull Monday bounce yesterday as tensions over North Korea eased a bit, though the US is still ready to take action if needed, especially if Guam is attacked. Diplomacy and China seem to be diffusing things for the moment. I imagine it will all die down by the end of the month and then North Korea will not lose face with the population. As things have calmed, the VIX (Volatility index) has dropped back to around 12. With the rise yesterday the 2 hour chart has gone bullish now and is showing support at 7310 – the same level as the 20 day Bianca channel for today. The key will be if the bulls can break above 7404 today – if not then yesterday will look like a dead cat bounce.
FTSE 100 Outlook and Prediction
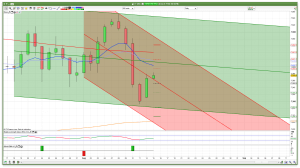
We had a bull Monday once again yesterday so will we see a bull Tuesday today? There is resistance at the 7385 level where we have the 200ema on the 30min and then a fib level at 7404 just above this. If the bulls do look capable of breaking and holding above 7400 then rather than a dead cat bounce it looks like it might be more bullish for this week. That means that we will likely see a rise to the top of the 10 day Raff at 7485.
If the bears however reappear at the 7385/7404 area then a trip down to 7310 looks likely, where we now have support on the 2 hour chart. Below this then the recent low at 7295 is still valid as support, but if this breaks then the picture looks a bit bleaker and we are looking at 7200 or lower.
For today though, I am watching the 7385/7404 area as resistance and 7310 as support and I am thinking that we will probably see both those areas today.
Membership
Want more detailed analysis for FTSE 100, DAX, Gold and S&P? Then please join our active members community.
What you get
- Daily Analysis pre market open (sent around 7am each day) for FTSE, DAX, Gold and S&P.
- Daily email pre market includes my trading plan for the day including ORDER levels, with stops and targets/limits
- WhatsApp and webinars group membership for discussion and realtime trade updates
Short term trend is turning up on the one hour candlestick chart with 7340 as support.. We will have to see what our friends across the pond do as we always follow them..
Morning George can I just ask you please are you taking the support at 7340 from the 50 sma / ema on the I hour chart? And secondly are you referring to the bullish green candle and the fact the Rsi is edgeing up? All on the 1 hour Ftse chart….thanks…..
The Macd on my chart is in a narrow steady red band……I dont really believe in technical analysis a great deal but it must influence traders so just picking bits up as I go along….most of what I do is what I think it’s going to do to be honest….but trying to understand how others read the charts…
I love MACD and EMA, I use 3 EMAs. But most important is to identify waves, pay attention to fibs, trend lines. I don’t have volume on my platform so use what I got.
Hi Jack I have SMA s on my charts 200 100 50 20 10 5 ….RSI and Macd that’s the only indicators…….I do find the market respects the sma levels more often than not……The RSI I find invaluable…..but the Macd I don’t really need TBH….There is a lot of information in the candles though I think….pin bars hammers etc and the channels can be really good also…..But I still mainly go off what I think more than anything ……Good Luck Jack…..
Hi Mate, I keep the charts simple , I use the 50 sma
The slope tells me which way its trending..
Volume is far better than macd or stochs etc
Thanks George …..the only place I can get an idea of volume that I have found is investing.com Ftse chart……my brokers don’t seem to have any indicators for volume…..it is really important as well …probably why it’s not being shown I guess….
use ig index ftse chart it will show volume..
Ok thanks George …..
7425 should be achievable today or tomorrow.
Still bearish as long as 7380-90 area holds. Sterling has tanked on the back of the CPI data, probably going to bounce from oversold soon and FTSE to drop back. That being said, clear 7400 and the next area of interest is 7440 for me
For some reason IG haven’t executed my stop with that phantom spike to 7419.. stop is at 7405. If it goes I’m out for the day
Yeah baby.
There are no magic indicators. What matters most is a consistent approach. On one timeframe. The higher the timeframe the better.
Thats my long closed for half per cent. Failurd to hold above 7400. Unforgiveable.
Nice work.. it’s been a weird one today
Pretty dull. If it held above 7400 – I would have too.
Mcg ….I was just wondering,do you base all your trades on technical analysis or on a personal interpretation of where you feel the market might go..Just curious how others plan their trades and attempt to forcast market movements…Thx…
First and foremost I’m looking for trade set ups and by that I mean areas I can buy or sell against with a tight stop. For this I use the previous turning points (7300, 7380, 7440 etc) and also the previous days close price as pivots. Sometimes this works well.. today was tricky though. Could have bought 7350s area this AM and also selling the 7380s but they pushed a bit beyond that today. Then on top of that I’m trying to guess the overall trend.. higher lows and highs is an uptrend and lower lows and highs is a downtrend. The last clear trend on the FTSE was April-May time when we went from 7100-7600. Since then it looks like 7600 is a top of some importance.. but we haven’t actually managed to get much going on the downside. So we’re basically in a sideways to down market. Then I’m overlaying seasonality, the length of time we’ve had since the last decent sized drawdown and that market breadth in the US is weak (i.e. Number of stocks declining is increasing) and concluding that a correction is due. That’s the main thing making me think we see 7100s before a break above 7600. However, that being said it’s an incredibly difficult market to trade with a medium term view as for the most part it’s a choppy mess. Through 2011-2016 there were a lot more clean 3-5% moves both up and down. Far easier than the current environment where you’re forced to focus on the next 50 points all the time
Thx Mcg …….I recognised the market environment from January through to March as a bullish period with a tight range…did well then….anyone could I guess…then I made some bad errors ,then I had another successful run from May to about 2 weeks ago…..now it seems every trade I make is wrong……I don’t think I’ve ever had so many bad trades in a row…..Its like now we have a 9 pt divi tomorrow and options ex on Friday ……I would expect it to go up but im at abit of a loss just now…just don’t know ……cable is dropping and the NK thing makes me think it’s going up…..news like that is sometimes headlines and it goes up but like you somethings telling me your right about a drop…it just doesn’t feel quite right….can’t explain it…..still think 7600 will be achieved at some point this year but not yet I don’t think…just going to have to keep plugging away till I find my feet again…..good luck matey….
I find the divi an annoying distraction tbh.. only have to see what happened last week to know that it doesn’t always rally but still makes it hard to take shorts even if you think it’s the right trade. Opex I only pay attention on the day as there’s no set pattern in the lead up. For tomorrow I’m thinking bullish above 7380 but not sure on the upside.. 7440 is the next key resistance. However, the US markets are looking indecisive and we could go down whilst below 2470s so all in all I’m cautious and thinking there’s some downside still to play. Are you still short from 7300? I’d say if you’re on a bad run you need to cut the losses early to avoid the swings.. just play the highest probability set ups and get out if it doesn’t go to plan
anstel, I didn’t read until now, holidays. I think too many SMA is also not great. 3 is enough. 2 for crossover and 1 for overall trend. What do you need another 2?
MACD and RSI are also on my board. I never use RSI just keep an eye on it, but use MACD all the time. TBH I am not the strongest on Candle patterns although I am able to recognize some of them when they occur, I cannot remember what they called though. 🙂 So it is not all intuition as I can see 🙂
Jack Hi….yeah I can’t make my mind up…..we have Dow at just over 22000…Dax 12200 Ftse under 7400 at the moment…..Two ways to look at it Dow 170 from top…1000 pt sell off very possible which is why I think Ftse is cautious…. OR the Dow at 22000 Ftse needs to catch up…..think perhaps the sell off as its August and lots on holiday….What are your thoughts. ?
Hi, I didn’t trade much lately, maybe sometimes a short scalp, because with the distractions here at home it is not a proper trading. We’re going on holiday in less than a week also. But today I tried longs after 3pm on Dax and exercised my techniques a little bit. It feels to me that the market pauses and waits for something. I knew the Korea dip would be bought, I thought about it over the night as it was a good opportunity to buy.
Now I’m looking at daily and see different pictures: Dax toughed prev. support 11940 so imagine will bounce but it is in a downtrend channel, but that support could be broken this time as MACD is quite low. FTSE didn’t break 7294 but may do so if it retraces to 7450-60, EMA did turn down, but you never know, uptrend will be fighting all that, it won’t be easy. Dow is just going up but maybe ready for a test of 21816? Today’s candle looks like pushing down. GL for the rest of August.
Trends are good in hindsight and there are always at least 2 on a chart – an up trend and a down trend. Plus you never know when these will turn. So they are not very helpful. You will often see George state the short-term trend is….
This is informed, he knows it is of limited value but may not want to trade against it.
A better approach is trade set ups on SAR ala Nial Fuller. The hammer candle defines the risk. The trade can be continuation or reversal. Simple and effective.
I use my own variation on this with one forward-looking indicator and a slightly different view of where the stop-loss isbuf it is probably not superior to Fuller.
But it has been successful. Wouldnt change it.
There is no such thing as a forward looking indicator