
Good morning. Nice bounce off the 6800 level yesterday though it took a while to get going, and a nice rise virtually to our 6850 target thanks to the ECB and the negative interest rates. Unfortunately the short order at 6850 didn’t quite get hit which was a shame as the price fell right back to 6800 again for a nice double bottom bounce. Will have to see how the negative rates play out over the forthcoming months, though they didn’t go for more QE which was widely expected. Today of course is NFP (Non Farm Payrolls) in the US at 13:30, an increase of 210k expected. Going to get jumpy then!
Asia Overnight from Bloomberg
Asian stocks rose for the fourth straight week and emerging-market currencies strengthened after the European Central Bank cutinterest rates to fight deflation. The dollar headed for its best week since April versus the yen and U.S. index futures climbed before employment data.
The MSCI Asia Pacific Index added 0.3 percent by 1:31 p.m. in Tokyo, heading for its highest close since Oct. 22. Standard & Poor’s 500 Index futures added 0.2 percent. Japan’s Topix gauge rose for the 11th time in 12 days while the dollar is on track for a 0.6 percent gain against the yen this week. The Malaysian ringgit strengthened 0.4 percent versus the greenback and China’s renminbi increased the most since May 29. Copper and aluminum retreated while gold held yesterday’s 0.8 percent gain.
ECB
The ECB took deposit rates negative, the first major central bank to do so, and offered liquidity to lenders to encourage credit growth. Analysts predict 215,000 workers were added to nonfarm payrolls in the U.S. in May, after the biggest increase since the start of 2012 for April. The People’s Bank of China boosted the yuan reference rate by the most since January.
The ECB’s moves are “growth supportive and a lower interest-rate backdrop is positive for equities,” said Chris Green, director of economics and strategy in Auckland at First NZ Capital Ltd., which manages $1.4 billion. “There’s still the impression that the labor market in the U.S. is a relatively positive story. But it would be a surprise if momentum was maintained at the levels we saw in April, and so the expectation is that we’ll see some modest pullback.”
The ECB’s deposit rate was cut to minus 0.1 percent, while the benchmark refinancing rate was reduced by 10 basis points to 0.15 percent, with economists surveyed by Bloomberg projecting a deeper cut to 0.1 percent. The marginal rate was shaved by 35 basis points, or 0.35 percentage point, to 0.4 percent.
ECB President Mario Draghi said the central bank will begin new, “targeted” offerings of liquidity to banks to encourage them to lend money to the real economy. While conceding that rates are at the lower bound “for all practical purposes,” he signaled the ECB is willing to move again.
Asian Stocks
Nonfarm payrolls in the U.S. rose by 288,000 people in April, the most since a 360,000 advance in January 2012. Claims for American unemployment benefits climbed by a more-than-estimated 312,000 in the week to May 31, data yesterday showed.
The MSCI Asia Pacific gauge is up 1.2 percent this week, poised to cap the longest run of weekly gains since March. The Topix (TPX) added 0.2 percent today, headed for a weekly advance of 2.7 percent. The yen, regarded along with gold as a haven investment, was little changed at 102.34 per dollar after gaining 0.3 percent yesterday.
Hong Kong’s Hang Seng Index fluctuated. A gauge of Chinese companies listed in the city slid 0.2 percent as the Shanghai Composite Index retreated 0.6 percent. Australia’s S&P/ASX 200 Index rose 0.6 percent. South Korean markets are closed today for the second time this week.
Support
The International Monetary Fund said yesterday China’s policy makers still have tools to keep economic growth at a medium to high level. Trade data on June 8 may show exports climbed 6.6 percent from a year earlier in May, more than April’s 0.9 percent growth, according to the median estimate in a Bloomberg News survey.
“The fact that the ECB is taking further measures is a useful reminder of the massive policy support that global markets are still receiving, which should be supportive for global growth and risk assets,” Christian Hawkesby, head of fixed income and economics in Wellington at Harbour Asset Management Corp.
Jobs Data
S&P 500 futures are signaling the gauge will extend yesterday’s record close of 1,940.46. The U.S. Bureau of Labor Statistics report today may also show private payrolls, which exclude government agencies, increased 210,000 in May after a 273,000 gain in the previous month, according to the median estimate in a Bloomberg survey of economists.
Fed officials are watching the labor market as they move to complete their bond-purchase program late this year and start considering the timing of the first interest-rate increase since 2006. Central-bank stimulus has helped propel the S&P 500 up by as much as 187 percent from a bear-market low reached in March 2009. The gauge rose 0.7 percent yesterday to an all-time high of 1,940.46.
FTSE Outlook
The key slightly bigger picture levels I am watching today are 6800 for support again, and 6875 for resistance where we have both the top of the 10 and 20 day Bianca channels, as well as the 10 day Raff. If it spikes up to that level on NFP then that could well be a good short. The daily pivot is 6818 today, so we may well get initial support there, but its worth noting that the FTSE is lagging the S&P which yet again went on to make new highs. Or is the FTSE telling the truth and the others are just getting ahead of themselves (looking at the S&P likely to hit 1945 today).
Initial resistance today is 6848 then the 6875 area (with a stop above 6785). If that were to break then 6912 is in play as the next resistance. Support wise after the 6818 pivot is 6800 and then 6789. If the bears get fuelled by an NFP figure that upsets the market and really start to go for it then 6700 beckons.
I have put an initial rise to the 6845 area but pre NFP is going to be pretty choppy, with most keeping their powder dry.
Morning all. Hope you all had a good day yesterday? Anybody into any trades yet this morning?
G. Morn Nick..this is my game plan for the DOW..I think, according to my structure configuration, the DOW has another 1% to 3% on the upside, most probably the lower end. The Dow will have a decent move down. Don’t know to what level yet, it is dependant on how much it retraces back up after making the high. The eventual low when it is made will take the DOW back up to…I’m getting ahead of myself! Let’s concentrate on this coming high. So, what I am going to do is to decide what my total short position is going to be…then split that into 10th’s…I will place orders of each 10th at the following levels..16,950/17,000/17,050/17,100/17,150. If I am filled at these levels I will be short 50% of my total desired short position. The balance I shall short, again in increments, on the down side. I don’t think this will be THE high. If I am right the next high will be a marginal new high.
If I see a reliable setup on the hourly charts which suggests that structure is weak then I shall add to my shorts irrespective of the levels stated earlier and adjust my risk accordingly.
This is a positional trade…I can still trade from the long side off the v.short term charts…but this plan is for the bigger picture… Thats it…game plan in advance, I know my risk…no hassle, no worries.
In fact it doesn’t matter what time frame I am trading, game plan and managing the risk is always essential…
Not enough movement for a trade for me.
But I expect a rise later next week.
4 hour chart – Short AUDUSD @ 9355 stop above 9408
Will add to short upto 9388 incrementally…
Still short on Dax S&P but concerned over S&P. any excuse to move higher I think. May drop half of it. Survival!
FTSE target still 6865/70ish…but still don’t have my setup to go long..!
The reason I’m waiting for setup is:
1. to go long and
2. more importantly where I should place my stop to determine risk and position size
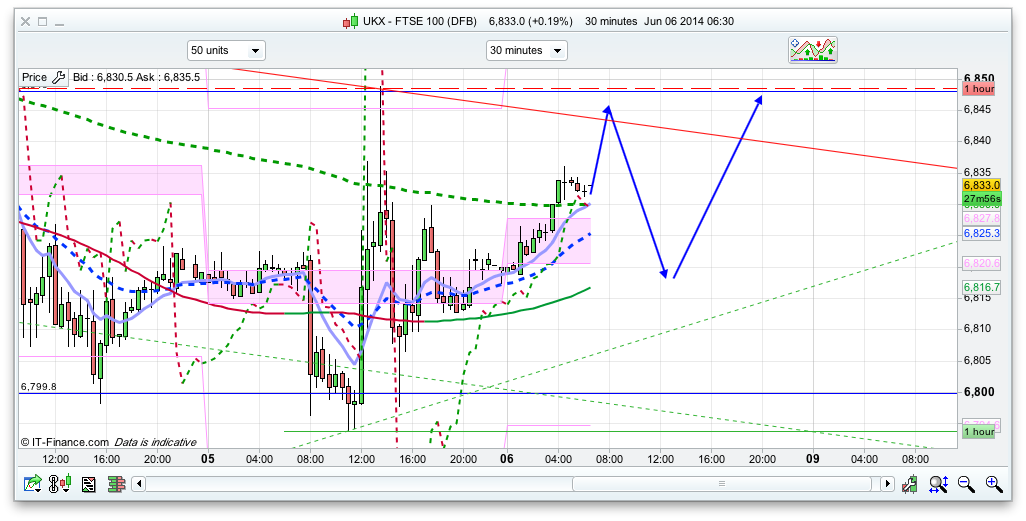
FTSE/4 hrs. — Growth outlook continues to improve as index pulls away from 6800 and the bottom rung of the current ϵ-channel running from the start of May this year. Apart from likely NFP gyrations around 1:30 pm today, it’s a question of how far this stage develops — 6850-60 should be safe enough 🙂 .
http://i1348.photobucket.com/albums/p736/jmca01/FTSE100DFB_zps54ec0ff2.png
Tempting to go long, belly are u in any trade?
I had a short earlier with a tight stop so that went on a quick bounce. Just watching now. Did you go long?
No, I have my order @ 20
Did you see that bounce on dax?
belly, you still holding your short?
Anyone join the live Intertrader NFP session? Normally good for a few points : intertrader.omnovia.com/registration
I Made a little off of the short now just watching. You?
I am not in anything. Missed that long earlier 🙁
Jim although I use MACD, I have to say 4hrs isn’t really the best, shorter time frames work best.
If you look at the S&P 4hr, you’ll understand, though that induce has mostly become a bogey. But then again I guess use it in conjunction with others.
ahwab, are u still holding all your shorts?
There are many occasions when I can see that the price of a particular market is probably going to a certain level…BUT until I have my setup I wont trade it! I don’t want an arbitrary stop here and there..below this bar or that bar, to press the mouse button on a sudden move etc etc…I’d much rather get stopped for a loss or break even on my setups, my trade plans…far more satisfying! I know that if I continue trading off my trade plan I WILL come out ahead at the end of the week, month and year…
Tempted to short Ftse now. What does anyone else think
Hi, If I had a setup in that direction I would share it with you…
…that doesn’t mean it cant go down!
…as I stated earlier today, I still have a target of 6865/70ish but no setup yet..it may even get there without me seeing my setup…so be it!
…What Im trying to say is its about probabilities…my setups give me a lower probability of NOT making a loss…I shared the AUSUSD trade earlier on the back of the setup…I have used these setups for a loooong time and they work most of the time…when they don’t I only lose a small amount by implementing risk/loss management…I always know where my stop is going to be and know where to take profits and when to put a trade on B/E…but these principles are not new to anyone on this board…
Been looking at US Light Crude for a week now…a setup maybe developing which could produce a move of 300+ points…
Yeah senu, still holding my shorts ftse average 6808, DAX 9890, S&P 1906. Running loss – 6k , with 3k of it on SP lol. Though scalped a fair bit yesterday.
If today turns about really bullish and continues into Monday then I’ll have to close some.
For now @ 6839 to scalp…
Stops are b/e just in case it blows upwards, added another short @50.
Gl all.
Anyone who hasn’t looked at the 4 hour chart on DAX should give it a little attention…I’m not a trader of such patterns but I do take notice of them….
If it takes out the high of yesterday the minimum move up could be 70ish points…such patterns have a tendency to also take out the upward sloping line then fail and price accelerates back down…take your pick…as I said I don’t trade such patterns as stand alone…only if it coincides with my own set up…
Short @ 42 risky one
Come on S&P do it for DDay – 1944 short in memory of #DDay70
At least let me get filled in the DOW…!
Weren’t the Americans on your side?
Yep, just fancied the number….. poetic and all
v. funny…
Shorted DAX 9990
Come on you bloody DAX DOWN!!!!!
Scalped 3 points…ftse though seems to holding back…again
This americans are trading in systems that only has buy button lol…
Many years ago I would have shorted the DOW right here off the hourly chart…3 moves higher with RSI divergence on the second high and now on the third high…but I have learnt my lessons of past…!!! Only if it coincides with my setup..
GBPUSD 4 Hour Chart…short @ 16817
limit @ 16590
Short at 9985 DAX
it will be interesting to see price action on ftse and dax as they get close to the highs of yesterdays 4 hour bar (that began at 12:00)…they both will show signs of what’s to come…ftse is closer its high than the dax ..
…inflection point…
Senu are you still short?
yes..
i still don’t have a buy setup on ftse…but it can still go up..!
Just an overall observation…There is nothing negative in the FTSE or DAX on the daily of 4 hour charts as far has bars are concerned…
…it’s only an observation, nothing more or less…NOT a call…
Ftse going up just for the sake of hitting that 6850 mark..
lol… I am out.. 🙁
…also, I have negative divergence on DAX daily but not on FTSE daily…again just an observation…
Shorted 6853 ftse
if the dax takes out its 4 hour bar from yesterday it too will have another fast push up…there are many shorts from yesterday and today on either side of 10,000..
…then ftse will have a move up to 80/85…I”l trade the DAX if it pops through 10015…but will have to be very nibble…could be the easiest 25/30 points made…! Let’s see what happens…
Nick, often the page on your site defaults to the right of my screen…have to hit the home page several times before the whole page gets proportioned ! any ideas? I’m using Chrome…
Stock I’ve had that put on Adblock , worked for me.
Ok, Thanks.. will try it..
Just shorted ftse
Short at 6855.
The beast is at its best. Is anybody taking long term shorts at this levels (Dow)? Is it worth it or we may see 17000?
The problems with Dow, it may continue rising through weekend and you find yourself on Monday morning at 16950 or something. And that would be sad if I shorted 16902. Yesterday I pulled +10 points at the end of the day 16842-16832 and good I pulled out as I would wake up with -23 points which would eventually just touch my b/e briefly in order to shoot up, I’d be -60 right now.
Gosh, I put a punt order for 16920.5 and forgot about it as I thought no way it will ever will be triggered. But it did. Now I am a bit confused, it keeps rising like a dough. Will it continue like this non stop to 17000? Looks like this trades stays over weekend now. Hopefully I will not wake up on Monday morning at 17000.
Anyone still holding ftse short? It keeps moving up.
Scary, isn’t it?
What a weird rise, do you know the reason for that?
Cannot believe this nasty spike at the end. bstds honestly. Weekend.
The guys at IG can’t wait to mess about with this after close and Sunday night! Had to close my S&P short at a big loss today but a lot less than the high. Still with the Dax short but 80 points off even now
What do you mean, mess about. What would they do?
So Javed ftse is heading to 6930 then?
Senu I still got my short @ 6953 uneffinbelievable how it still goes higher, expecting a drop of 30 points on open, biggest bs ever it was just destroying resistances
Jack 2 have you never seen the manipulation of he prices outside of trading hours? 6-7am is the usual time but Sunday at 11pm will be messy I think.
I don’t think I’ve seen anything drastic, but it is always happens outside the open hours and when the market opens it usually settles down. Am I right? However having said that I am a bit panicky right now, my trade 16920 is currently -22. I really hope for it to drop on Monday so I close b/e or something like that.
Sam
You would have to think so. A solid day on Monday and we should push through 6900….. then it will be all eyes on the FTSE in the media. Either way it should be short lived and has to be a shorting opportunity…….but the question is how long do you wait for the bend at the end my friend?
Good luck!
Yes Javed, am fairly confident ftse will push through 6900 next week. Am no expert, but reckon there might be pull back giving us shorting opportunity but really need a trigger for ftse to tank/sell off. If there is no trigger, 7000 is on cards. (I don’t want 7000, I am heavily short 6840 avg).
Anyone shorting Dow jones?
Me by a stupid mistake putting an order 16920, I thought it would never reach that, but here we are with -22 points at the close.
Out -8
ahwab — The indicator I’m using mostly, currently, is not the MACD. It’s one of mine, and simply calculates and averages price change (± growth) over time – quite a different principle. As for timeframes, choice ought to depend on what you are trying to get your mind around! 4-hrs. or daily is usually appropriate to the comments I make here. True, you can see a couple of days’ history via a 5-mins. chart, but to my taste, the 4-hrs. generalisation makes a much better job of that. See, for example, the descent to the local min. on 05 June, and subsequent rally. Which is not at all to say that the 4-hrs. timeframe is ideal for all situations!
You say: “If you look at the S&P 4hr, you’ll understand, though that induce has mostly become a bogey.” You’ve lost me! 🙂
Morning all. Anyone trading yet?
Still short on Dax. Thank god it’s a bank holiday there