
Good morning, I hope you had a good weekend. Now that the Scotland vote is out the way the political fall out continues in Westminster, with Labour wanting to keep the Scottish vote for their MP’s otherwise they are going to suffer. Been pretty bearish since the rise on the No vote,dropping nearly 100 since the peak, as we are at 6812 as I write this. I read a very bearish article over the weekend that would certainly put you off investing in equites, and in the mainstream press too – here. Going to be interesting this week, its looking fairly bearish with the S&P tumbling off that 2022 area it hit on Friday, and looking to be heading to 1980, its currently at 2002. 20 point drop in very short order will get the bulls spooked…
Asia Overnight from Bloomberg
Asian stocks fell, led by Hong Kongshares, and U.S equity-index futures tumbled with commodities amid speculation China may accept slower growth. Bonds rallied after officials from the world’s biggest economies warned of rising financial risks, and silver plunged.
The MSCI Asia Pacific Index dropped 0.6 percent by 1:19 p.m. in Tokyo, as theHang Seng Index retreated 1.3 percent on elevated trading volume. Standard & Poor’s 500 Index futures lost 0.5 percent. SoftBank Corp. drove Japanese shares lower. The yen climbed 0.2 percent as yields on government bonds from the U.S., Japan and Australia slid. South Korea’s won rebounded from a five-month low. Silver slumped with copper and nickel in London and Brent oil slid 0.5 percent.
China’s Finance Minister Lou Jiwei said growth in Asia’s largest economy faces downward pressure and reiterated that there won’t be major changes in policy in response to individual economic indicators. Group of 20 finance chiefs and central bankers said low interest rates could lead to a potential increase in financial-market risk, as major economies rely on monetary stimulus to bolster uneven growth. U.S. housing data is due today.
Lou “gave a real hint that the recent policy easing may actually be quite limited,” Stuart Beavis, head of institutional equity derivatives at Vantage Capital Markets in Hong Kong, said by phone. “We’re not just going to see this wall of money thrown at the Chinese slowdown.”
The Hang Seng Index is heading for its lowest close in about two months as the number of shares traded surged about 50 percent compared with the 30-day average for the time of day. A gauge of Chinese companies listed in Hong Kong slipped 1.8 percent in a third straight retreat. The Shanghai Composite Index fell 1.5 percent.
Flash PMI
The Hang Seng China Enterprises Index (HSCEI) slipped 2.1 percent last week to the lowest level since July. A preliminary reading on the HSBC Holdings Plc/ Markit Economics China manufacturing purchasing managers’ index is due tomorrow, with economists surveyed by Bloomberg predicting a drop to 50, from 50.2 in August.
China’s economy is growing in a stable way and operating within a reasonable range, Finance Minister Lou said in a statement published on the People’s Bank of China website. Macroeconomic policy will focus on “comprehensive” targets, particularly job growth and price stability, the statement said.
Australia’s S&P/ASX 200 Index (AS51) fell 1.2 percent, while the Kospi index in Seoul slipped 1 percent. China is the biggest trading partner for both countries and the world’s largest consumer of industrial metals.
Rates, Risk
The Fed will keep interest rates near zero for a “considerable time” after asset purchases are completed, most likely next month, it said last week as officials raised their median estimate for the federal funds rate at the end of 2015.
G-20 officials said yesterday in a communique released in Cairns, Australia, that they “are mindful of the potential for a build-up of excessive risk in financial markets, particularly in an environment of low interest rates and low asset price volatility.” The ministers welcomed signs of strength some key economies, but noted “growth in the global economy is uneven.”
FTSE Outlook
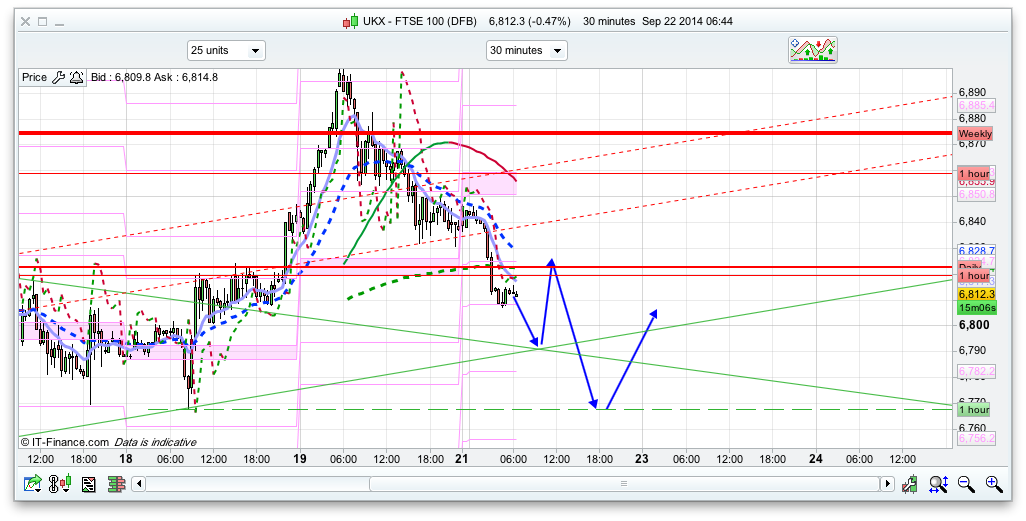
We have the bottom of both the 10 and 20 day Bianca channels at 6765 and 6769 so I expect if we get a dip to that area to see a bounce from there, which looks likely now we have moved below 6830. Todays pivot is 6844, and there is some initial support here at 6810, being the 25ema on daily. I don’t think it will be seen today but a move above 6900 still targets that 6936 area, with 6950 above that. We have the bottom of a rising ProTrend channel on the 30 minute showing support at 6790 so if this initial drop continues can see a small bounce there, probably to the 25ema rather than the pivot, before further downside to that 6765/6769 area. I do think we will get a decent bounce there (bottom of 10day Raff and the Bianca channels too), and maybe that level will coincide with the 1980 S&P level later.
Javed and what about October ?
I think Javed predicated Up last quarter of this year.
*predicted to be
FTSE at 6788 5 Min Chart
Keeps backing off from the 30 period average (let’s see what it does here).
Can it close above 6791 ?
What’s the upside 6818 ??
Gone Long 6794
Sorry PMS and Sam
Been tied up. Yes I expect the last quarter to be positive.
So I don’t have a target for October as such. If I was to make a prediction based on my model….I would say 6690 for end of Sept and 6780 for October but I wouldn’t trying to trade off them levels…….and the price at the end of October is not relevant to me….but tye price at the end of Dec.
Hope that helps.
MLawrence / PMS
As promised the historical Intraday High to Low moves for the previous 30 years:
It probably won’t come out too well here so can email it to you if interested.
Year
Average of Intraday HI-LO
Average of Intraday HI-LO (%)
1984
8.24
0.76%
1985
8.80
0.67%
1986
12.39
0.78%
1987
25.45
1.29%
1988
13.94
0.77%
1989
19.14
0.88%
1990
22.16
1.00%
1991
20.83
0.85%
1992
25.41
1.00%
1993
22.46
0.76%
1994
30.59
0.97%
1995
23.05
0.69%
1996
24.31
0.64%
1997
52.99
1.11%
1998
89.72
1.61%
1999
91.87
1.47%
2000
104.80
1.65%
2001
96.83
1.78%
2002
92.53
2.11%
2003
59.92
1.52%
2004
39.14
0.87%
2005
37.91
0.74%
2006
58.34
0.99%
2007
82.85
1.30%
2008
135.05
2.66%
2009
88.54
2.00%
2010
78.37
1.45%
2011
94.84
1.71%
2012
62.89
1.10%
2013
62.91
0.97%
2014
56.05
0.83%
Grand Total
52.96
1.20%
thanks Javed.
Long Dow 17244 – 6 Point stop
closed it for a quick 24 points although it could continue to 17300.
closed my DAX short for 10 point gain but probably should have kept that and tempted to short again at 9790 but did not in the end.
DOW looks pretty sturdy doesn’t it?
what is sturdy ?
Sturdy= strapping, well built, well made, muscular, athletic, strong, hefty, brawny, powerfully built, powerful, solidly built, solid, burly, stocky, thickset, rugged, substantial, robust, vigorous, tough, hardy, mighty, lusty
– All commonly used Technical Analysis Terms !
thanks
ha ha. i might throw in a “FTSE looking robust and lusty” in tomorrows post!
how about “mined” 🙂
yeah might as well put that in.
Robust FTSE mined a few stops with the dip to 6770, before the bulls got lusty with a rise to 6800….
Hows that?!?
Hi Dutch,
I was looking for a 50% retrace from friday’s daily candle on the Dow to short it. Looks like its not going to get there but looks like more downside coming.
Yeah agree looks that way. What you think of DAX. Still think after a bit of a correction there is lot of upside potential. What you have as support levels around here 9730/20?
9720-10 area should be some support but I won’t go long, the trend is starting to reverse. I am only looking for any shorting opportunities
Long @ 6769
long DAX 9748 stop 35, target 67
FTSE 5 Min – 6767/70
This may be a reasonable entry point based on the MACD and RSI
Yep, Im in at 6770
in too at 6769
Isnt this bit risky entry point ? Given the fact Dow is still sitting on all time high ish and further correction can bring ftse further down — Also bearing chineese news going around from last night
Thanks Javed,
How’s everyone getting on today? I think we’re all as quiet as the market..?
There’s always something to worry about …
http://video.cnbc.com/gallery/?video=3000312228&play=1
Episode 2 of the programme about Traders on Beeb2 tonight @ 9..
Reality check after Friday now.
QE ending, growth slowing, higher interest rates next year. I personally get a bit nervous every time i go long…
That being said we do buy when there are concerns keeping the market down and sell when concerns are gone. We are probably still in the selling process though ready for when the concerns come flooding back. Safer in my opinion to be short.
Short DAX 9750 – 10 point stop
good short. I got out of my long at 9753 and getting out of my long FTSE 6769. don’t like this market today
Closed my DAX short for 13 points. Gone Long the DOW at 17202 – 10 point stop – target 17230. I have a sell order at 17240
your a busy boy! I’m off home to take a long bath and think about switching to few more long term trades now that we have less political and social economical stuff going on around the globe.
Stopped out on the trade…clearly over trading..one of the things which I intend to control..
yeah know how that goes and to prove it, just went long DOW 17667
oops 17167
china this night with data . Unless SPX does one of those magic tricks as always at end of the day, do not see FTSE going anywhere after hours.
looking to buy spx at 1991
A good sell off today a bit more, would be good for tomorrow as the news come out overnight.
Anyone saw already that candle FTSE did tooday ? It has to mean something. +-6700 tomorrow ?
6725 is good start
Sorry, this a bit late, but have been working on a new indicator-independent system (apart from 1 optimised MAV). Last recommended trade ‘Sell @ 14:40’.
http://i1348.photobucket.com/albums/p736/jmca01/FTSE100DFB_zps8fed83d3.png
Hi Jim,
Looks promising…
on the coding I’m not sure if you are aware that you can add time to the conditions like this:
// Conditions to enter long positions
indicator1 = RSI[19](close)
c1 = (indicator1 070000 AND TIME <170000
so when you're back testing it will only do it between 7 o'clock and 5 o'clock..
in this example..
I noticed that PRT has a new Manual for coding which has got quite alot of new stuff in it. I haven't been through it yet – can be a bit heavy sometimes !
Hi Hugh,
Thanks for that. The system depends on a parameter optimised over a given period per series holding good in the short term. So we’ll see how safe the assumption is in practice. I’ll leave the system running tonight and see how it does tomorrow without re-optimisation. Come to think of it, ProRealTime might close me out — your software hint might be very relevant. E.g., I could optimise for the previous day and then apply the parameter to the current day, when using a brief bar of say 10 mins.
Jim – I’ve just noticed that that post didn’t seem to copy and paste the code as it should be:
Here is the whole code:
// Definition of code parameters
DEFPARAM CumulateOrders = False // Cumulating positions deactivated
// Conditions to enter long positions
indicator1 = RSI[14](close)
c1 = (indicator1 070000 AND TIME <210000
indicator2 = MACDline[12,26,9](close)
c2 = (indicator2 070000 AND TIME = 80)AND TIME >070000 AND TIME = 4)AND TIME >070000 AND TIME <210000
IF c4 AND c5 THEN
SELLSHORT 10 PERPOINT AT MARKET
ENDIF
// Conditions to exit short positions
indicator6 = RSI[14](close)
c6 = (indicator6 CROSSES UNDER 28)
IF c6 THEN
EXITSHORT AT MARKET
ENDIF
// Stops and targets
SET STOP pLOSS 100
SET TARGET pPROFIT 23
Jim – Sorry I think HTML script is doing something weird here and keeps misinterpreting text.
Basically what you want to do is
C1=(indicator1070000 AND TIME <210000
You need to add the Time Parameters to both the Long/Short entries
That’s still not right !!
Jim, keep coming with that signals in real time tomorrow. Thanks
Will try PMS — tomorrow is a ‘medical’ day. 🙁
GL
Generally looking for a sell providing good impetus for rally to year end. Still thinking we will finish the year at around 7000 (7002 was the prediction I made at the beginning of the year).
My view is that next year the bull ends……..and we have a 10-15 % correction….certainly to around 6300 (6338 anyone?)
Bought at 1994 on spx, looking that the intraday bottom was reached
Stopped out at b/e. Too early for a bounce, maybe.
I think he’s more a ftseman
anyone short or long ? Entered again but closed at end with small gain. See this going lower tomorrow.
Long 6747
Morning Hugh
Any reason for your entry
Not surprisingly
all technical indicators will be showing a Long Signal
6747 was the low about 7 days ago.
We’re banging on the trend line (Daily)
Pivot S2
I’m going to go Long one more time if we see 6720.
Order actioned as I write..
This is the first month over the last 5 months that I am not in profit at this stage in the month – I need >6747 to level.
hugh – 23rd page open – lets talk there
RC- Just going back to the technical indicators…..
One of the one’s I like is the Elderay indicator.
(Sometimes this not available on some platforms)
It can measure the distance from the average (200) and the current price.
As I’m looking at a 5 min Chart the 200 period MA is 6771. FTSE 6722
It produces a gap of about -50 (MA-Price).
Two things may happen.
The gap will close (FTSE go up)
or
The FTSE continue to fall and the 200 MA move down in value.
Nothing is ever certain.
I don’t like doing this …as it ruins the trading strategy and confuses it…
I have put some Short orders in 6700 – 6705 – and will play these if these FTSE continues to move lower .