
Yesterday turned into a bit of a tricky one especially with the afternoon chop around the 6800 area not presenting any decent opportunities for a decent runner. The FTSE was more bearish at the beginning than expected (only getting about 15 points from that initial dip) so then the long off the pivot was stopped out; at least with a tight stop damage was minimal, however various knife catches at 6800 yielded a few points though it did start to look like we would dip to the bottom support level at 6777. Alas not and then there was a very weird pump and dump at the close, probably trapping quite a few longs with its fast drop. Seemed a bit strange for such a small divi so maybe more to it.
Asia Overnight from Bloomberg
Asian stocks pared declines, with the benchmark index set for a first monthly gain since October, South Korea’s won strengthened and natural gas headed for its biggest three-day rout since 2007. The yuan traded near a seven-month low amid concern about financial stress in China.
The MSCI Asia Pacific Index slipped 0.1 percent by 2:34 p.m. in Tokyo, after falling as much as 0.4 percent, and has advanced 2.3 percent this month. The CSI 300 Index of shares in Shanghai and Shenzhen headed for its lowest close since December 2012 while the yuan was little changed after weakening the most since 2010 yesterday. Standard & Poor’s 500 Index (SPX) futures rose 0.3 percent. The won climbed 0.7 percent versus the dollar and the currency of Australia, which counts China as its biggest trading partner, fell 0.2 percent. Gold was steady after a four-day gain. Natural gas dropped 2.7 percent.
The yuan’s decline coincides with a crackdown on risky lending that’s seen some Chinese banks curb funding to property developers and related sectors such as steel and cement. A meeting of lawmakers to set economic policy and growth targets begins next week in Beijing. The U.K. reports preliminary fourth-quarter gross domestic product figures, while data on U.S. mortgages and home sales are due today before durable goods orders and jobless claims tomorrow.
“There is a little bit of unease around China and what’s happening with the currency,” said Peter Esho, a Sydney-based chief market analyst at Invast Securities Co. “The market is going to remain flat for the rest of the week. The macro data ramps up next week and I think that’s what traders will be eyeing. Europe will continue to improve, as will the U.S. Asia is still probably going to consolidate further and pick-up toward the end of the year.”
US Futures
The S&P 500 ended the New York session down 0.1 percent, after fluctuating near its record closing level for most of the day. Financial, industrial and technology companies led declines in seven of the 10 main industry groups with the Conference Board’s U.S. consumer confidence index dropping to 78.1 for February, trailing a median economist estimate of 80.
Data on mortgage applications and new home sales in January is scheduled for today, with Federal Reserve Chair Janet Yellen to testify for the U.S. Senate on monetary policy tomorrow. Yellen said this month that only a notable change to the U.S. outlook would prompt policy makers to slow the pace of cuts to its stimulatory bond buying program.
FTSE Outlook
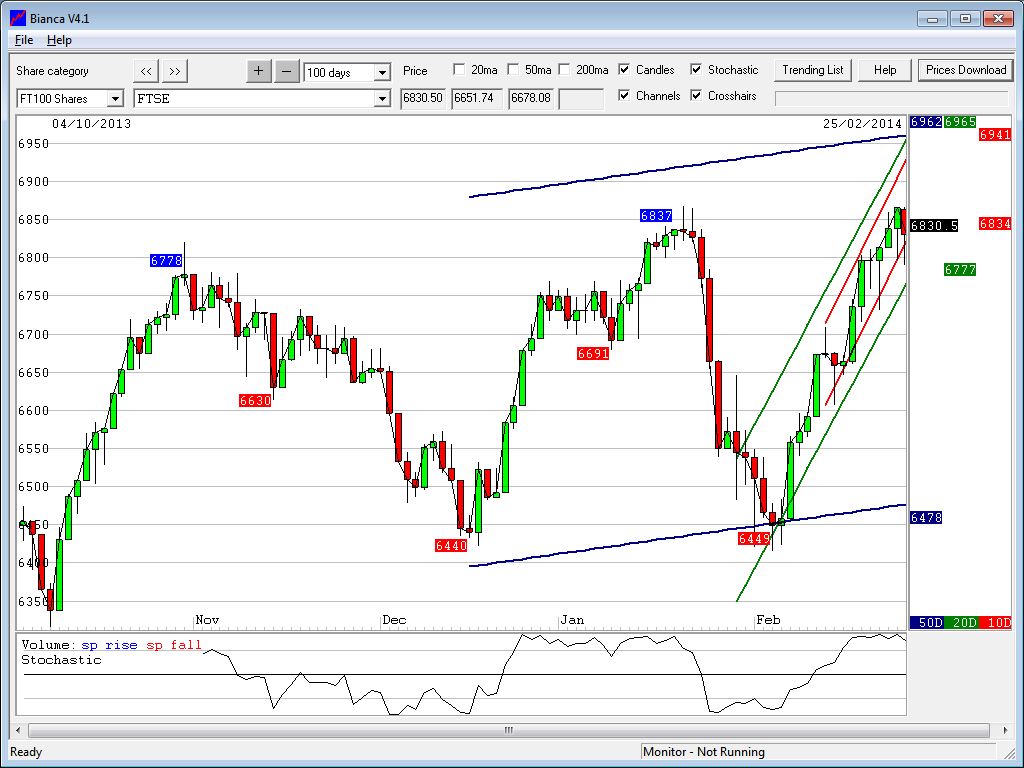
As I write this the FTSE is right on the pivot at 6829, after a pretty strong overnight session in the end, though there was yet another test of the 6795 area. It therefore looks like there is some bearishness creeping in so we need to stay nimble. The Daily Raff channels have support at the 6820 (10 day) and 6793 (20 day) so may hold for the moment; we are also at the bottom of the 10 day Bianca channel near enough (its 6834), though with the 20 day at 6777 (funnily enough the support area flagged up yesterday) a long from there is probably worth a go.
I have put 4 trades below, each of one of the more major support or resistance levels, and therefore with fairly tight stops – if the entry level breaks then it will probably fall/rise to the next one.
If we do break through the pivot with some early bull then 6846 is the first resistance then 6861 and 6878. I have put in a drop from that 6846 level though with the EMA’s being positive and a 10 minute channel with resistance at 6855 it might just sneak a bit higher. I think an initial short from that area will be ok but initially it looks a long.
Support wise, there is a whole load from the daily channels at around the 6790/6800 area though obviously we had quite a few tests of that level yesterday – the more its tested the more likely it is to eventually break. Should 6790 break, then 6777 (bianca 20 day is the nearest level to watch, then 6753, and 6715.
so looking at my charts it seems the market will hit 6790 before any long,but if has the potential to go down to 6755.
my free tip!!!!!!! i have a buy ticket at 6790 taking profits at 6830 with a 10 point stop. keep stops very short as there is a potential the market to fall down to 6755.
i also have a ticket to sell from 6835 taking profits at 6790.
at the moment the ftse is very devilish….. Good Luck peeps!!!
Not bad tip actually, you were spot on with entry.
How did you know?
just through intensive research of chart patterns and trends.
important skill you need to have is know when your wrong and to cut out of a bad trade.
i shall put another free tip of the day tomorrow, i hope people can benefit from it.
Is it just me or is the Economic Calendar widget not working?
Nope, doesnt look like its updating, thanks for letting me know
Will just leave it there, pretty sure they will fix the data feed at some point
Nick – today’s plan so far so good. Id be delighted if it can get to 6880 from here..
Would be nice!
im in a dilemma….economic figures look good, but the price action of ftse does not show it, also my indicator (modified one) is starting to show reversal..becoming bearish now very quickly 🙁
I most likely be looking at a short around 6829 and hold till end of week
Yes I know what you mean. I am still long from about a week ago but the more we cant push on and hold much above 6800 the more I tend to agree. 6800 seems to be a key level which if properly broken would probably lead to me closing of the longs and considering shorts
But what is your old indicator telling you?
Short @ 6810
Booked @ 6799
have no idea whats going on, spx surely is going to want to open above 1850
Looks like maz way (6790)
mmmm yup
FTSE still not tested 6790 ? Support around 6790/6800 is pretty strong 😉
Somebody somewhere seems to have put the kitchen sink into stopping at 6800
6800 too strong
1844 key on spx
hope this fly’s
ouch! is ftse breaking now to downisde?!
everyone loaded then
its on the runway 😉 hope it don’t crash
1844 broken oh sh$£$
ahh lol the psychology of trading, after yesterdays big loss i was too scared to short today (or either it was too hard to trade these last 2 days due to volatility)
Certainly been choppy
Do you still think it will reach 6880 today ?
not a chance
Not now, theres only an hour left!
6830 possibly, would need a bullish US though
Its going down, I’m yelling timber.
Glad your Yelling was not asking you!
You clearly did not understand the reference love
was talking abbout YELLEN 😀
Im in a full bear mode now…just need nice entries (e.g 6830 be perfect for me if we see it today)
Choppy trading hurting my account. I usually love these days but keep hitting stops which are too tight
Tell me about this.
if spx closes above 1852 were are in for good times
The rewards of patience have been reaped 🙂
dow flight 70 points… will it reverse now ? anyone shorting?
Looks like it was a great op to buy off the previous support 16160
Looks like the bulls are taking on the bears, Maz’s tip of the day worked nicely (6790 long). What are we predicting for close? 6825?
wasn’t that Nicks….
Short @ 6814
o you do make me chuckle
😉
Hope you banked tat 6 point move,
No, looking for 6790-95 range
Back in form 🙂
When I loose discipline, I loose trades 🙂
Lose- Not win
Loose- Opposite to tight
lol…. haha…rite ..
Right
That’s my longs closed into that end of day rise that I have held for a week or so – this rally seems to run out of puff in recent days in my opinion. Plus put a small short in to start things going on the downside…
Before shorting always spikes. Works most of the times. Well, as many times as I noticed.
Yes you are probably right – but I am more of a swing investor looking to catch trends over a 2-4 week period so not too bothered by intra day goings on – find that too time consuming and hard to do reliably. My plan was as soon as 6800 broke to close the longs on the hopefully the end of day surge. Worked a treat as sold longs at 6815 and immediately shorted (which I don’t find hard to do). which I will build over the next 50-75 points. This site is excellent as it helps me figure out entry points, gauge general sentiment etc. have no idea how low it will go but will reverse as soon as momentum changes – even if it is only a few days away, but normally it is 2-3weeks. Whenever it does this then ill close the shorts. Don’t want it to run too quickly down otherwise won’t build position fast enough.
Short booked
well done
cheers mate 🙂
It looks like Nick’s chart worked on Dow more than FTSE today.
I didn’t trade today because I am still in shock of what happened yesterday. Didn’t expect such an urge to drop so violently at 14.30
I’d like to refine my exit strategy as I found that the one I have is OK but I wasn’t prepared to deal with it in reality physiologically.
I think what happened: I was in shock that the money disappeared so quickly and I wanted them back and so I kept in hope it will turn back till it hit b/e.
Did anybody experience anything like this and how do you cope with it now?
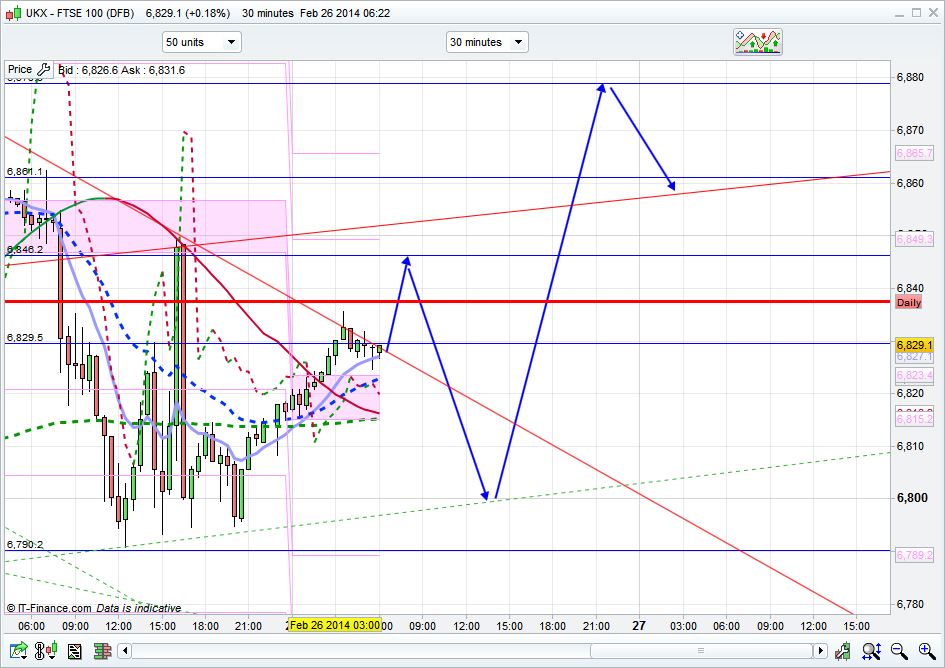
This is an update of a previous post — FTSE pointing down.
http://i1348.photobucket.com/albums/p736/jmca01/FTSE100DFB_zps59ea6945.png
From my experience its impossible to have an exact exit strategy to a trade.
When i started on the ftse i was in a trade where i could have gained 200, had to close the trade at a 500 loss
And i also was short on tesla, and you only need to see on its share price how well that trade went.
Even if you believe its impossible for a loss making company to keep rising ridiculously, you can still be completely wrong.
Thats why nicks stop loss strategy is pretty effective.
You only lose a few pips if its wrong.
I thought Tesla was profitable?
Thanks for that JSS. I try and get my entries of recognised S&R levels, that way I can have fairly tight stops. Better to cut the losers quickly. I tend to find if I enter at say a key support and then it breaks, its more than likely to get to the next support (vice versa for resistance obviously).
Staying on the sidelines but will start adding shorts over the next week. My prediction is a break above 6900 on Friday into Monday on fed remarks Thursday night, month end window dressing and month start cash injections. Sideways movement ahead of jobs report a week Friday then a drop. The market is set to get a cash injection from the vodaphone deal but if I had money to buy stocks, I’d rather put it to work when share prices were lower. Hence why I think we may see a share sell off followed by a rebound.
shooting star on DOW