
Good morning. Yesterday’s trading plan worked out pretty well with the dip to the 6640 level though it did take a while. A bounce there that still seems to be going as the FTSE has held up overnight makes me think that we will see the 6702 area mentioned today instead. There is also a chance of slightly higher and with the 10 day Bianca channel top at 6713 then that’s likely. Top resistance I have is 6735. We didn’t quite drop all the way to the 6630 to trigger the order long set at that level, but the rise did coincide with incoming Fed Chairman Yellen yet again saying that stimulus is here to stay for a while. Not great data for France yesterday with output falling and Hollande’s ratings falling faster than a dropped baguette to 15%.
A morning prayer for you all – Our Fed, Who art in Washington, Yellen be thy name, Thy printing come, Thy will be done by Ben as it is with Janet, Give us this day our daily billion, and increase our debts, As we bail out our debtors, And lead us not into inflation, But deliver us from down markets, For thine is the printing, the bubble and the euphoria, Forever till taper. Amen
[Not sure where this came from but one of the members posted it in the chat room and it seemed quite amusing!]
Asia Overnight from Bloomberg
Asian stocks headed for the first weekly gain in a month after Federal Reserve chairman nominee Janet Yellen said she would continue U.S. stimulus and amid speculation China will release detail of economic reform.
Japan’s Nikkei 225 Stock Average (NKY) surged beyond 15,000 for the first time since May, rising 1.9 percent and on course for its biggest weekly gain since December 2009. China’s CSI 300 Index jumped 2.9 percent, heading for its biggest increase in two months, amid optimism detail of policy changes decided at a Communist Party plenum will be released next week.
The MSCI Asia Pacific Index added 1.3 percent to 141.53 as of 12:47 p.m. in Hong Kong, extending this week’s advance to 1.8 percent. The gauge is set to snap three weeks of declines, the longest set of such losses since June. All 10 industry groups on the measure rose. Today’s surge in Chinese stocks reversed a slump on Nov. 13 when a lack of details from the leaders’ plenum disappointed investors.
“The pendulum has swung to the positive side after the disappointment with the plenum and that’s coming with all the good news about the Fed stimulus outlook,” Adrian Zuercher, a global strategist at Credit Suisse (Hong Kong) Ltd., part of the asset-management unit of Credit Suisse Group AG that oversees the equivalent of $404 billion. “Any policy changes are going to be in the right direction and improve market stability.”
Morgan Stanley said yesterday it expects China to outline economic reforms in the next seven to 10 days and that investors’ earlier concerns had been misplaced.
S&P
Futures on the S&P 500 added 0.2 percent today. The measure gained 0.5 percent to a record yesterday. Asked yesterday about stock prices, Yellen said she doesn’t see “bubble-like conditions.”
“Stock prices have risen pretty robustly, but if you look at traditional measures” such as price-earnings ratios, “you would not see stock prices in territory that suggests bubble-like conditions,” she told the Senate Banking Committee in Washington.
The S&P 500 has rallied more than 25 percent this year, putting it on pace for the best annual gain in a decade. The gauge has rebounded 165 percent from a 12-year low in March 2009, adding more than $10 trillion in market value.
Yellen & QE
“I consider it imperative that we do what we can to promote a very strong recovery,” Yellen said in response to a question during her testimony. “It’s important not to remove support, especially when the recovery is fragile and the tools available to monetary policy, should the economy falter, are limited given that short-term interest rates are at zero.
Yellen “provided a staunch defense about the use of asset-purchase programs and stated that U.S. Fed policy would remain in place while the U.S. economy remains fragile,” Matthew Sherwood, head of investment markets research in Sydney at Perpetual Investments, which manages about $25 billion, said in an e-mail. “This wasn’t just music to the ears of stimulus hungry investors, it was like listening to Beethoven’s Ninth Symphony.”
FTSE Outlook
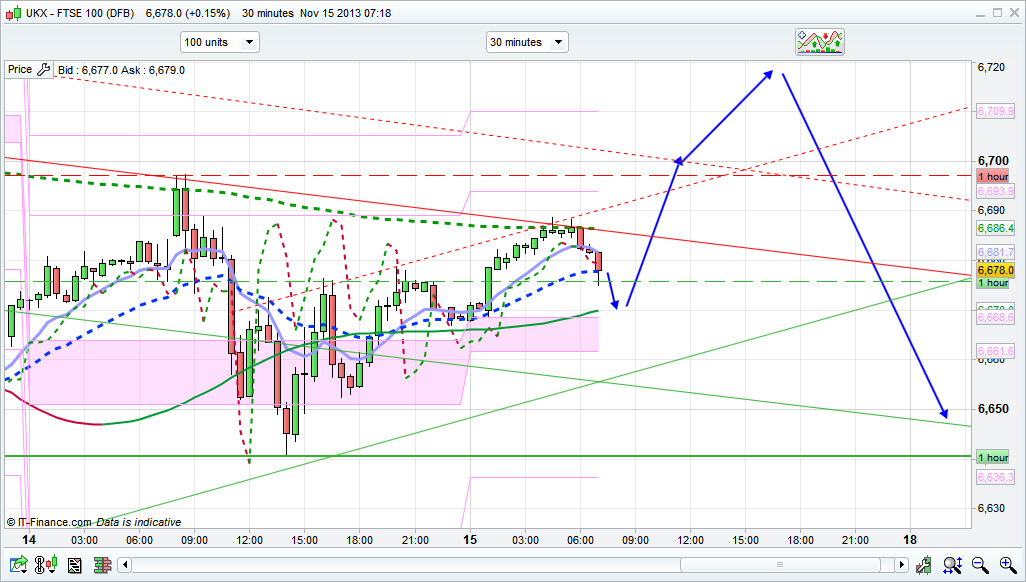
Initially I think that the 6887 area will hold as resistance after the bounce we saw yesterday from 6640 as we have a declining 30 minute channel there. If the price can hold above 6673 then we should get the 6702 area mentioned yesterday today, however, whilst we are at this level (6700) I am more inclined to start thinking about shorting the rallies. The US is at record levels, and they may want 16000 on the Dow if nothing else but for the positive headlines (brainwash the masses), and possibly 1800 on the S&P. Hasn’t QE done well to cure all the financial ills! If the 6738 breaks today to the upside then after that the next major resistance is 6845. I expect yesterday’s bull to carry on, at least initially today.
According to the chart we are waiting for a spike to 6720. But what if 6690 will hold?
I bet you are guys long from 6664 today.
Good morning… so today’s call is to go long above 6740. It goes with my view. But if we go low I will buy the dip. For now is too risky
Did you mean short?
I wouldn’t wait for 6740 to go long 🙂
if it breaks a trend line I have I will go long
Am expecting ftse to spike as soon as DOW opens (2.30pm), like we had last few days.
I will be buying the dips on ftse and dow
When/if DOW hits 16000, does that mean game over? Will the DOW finally have a pull back, pulling the FTSE back a lot..
Wow, I just noticed that DOW is at it’s all times high! It looks like it’s heading even higher to 16074, it may drag FTSE with it. Now I see what you mean.
i looking for the next dip before i buy probably around 6676 ish before it breaks 6700 possibly??
That’s what I was thinking, but it’s pushing up so strong and EMA are quite vertical. I think we missed the train from 6664
possibly, im still long from yesterday and my long order at 6663.5 was missed by 0.5 sods law lol
But on the other hand you have a winning position, I am not, you should be happy about it.
I only managed to computer at 9.10 when it was too ridiculously up for me to go long.
There’s a short, buy the dip.
lool so much for that then
I’m satisfied for today. Good weekend for all
Is it heading towards 6704 to break, what do you reckon?
Good week, sell the highs buy the dips, looking for 6710 today, then i`m done =)
Are you currently long?
waiting till 2-15 for dow to open to go long 3-5 billion QE going in today
Where did you get that info from? I agree though, but personally would wait for a dip on open as expecting it to test 15850ish, gap fill is 15880 as well
Wow, 15850 is too adventurous, miles away.
Its coming back slowly… Lets wait and see. Minimum Gap Fill at 15880… Don’t worry im in BTFD mode, but fancy a cheeky dip on open imho
.newyorkfed.org/markets/tot_operation_schedule.html
Thanks… As you can see it is one of the smaller days today, in fact pretty much smallest i can see on that list. Not sure when it kicks in. No POMO today also.
yea it states thursday/completion friday so its a little vague
I had +11 points today. You put me off with this “dip” talk on US open so I decided to take the profit once in a while. Who knows where US will open. More likely no more trades today.
closed at 13.25
LOL, just in time 🙂
waiting for 883 to long the ftse
Im seeing 6666-70 level personally to go LONG… Again it all depends on DOW / SPX opening. Looks like they may dip slightly, go for the gap fill before resuming uptrend later this afternoon.
That’s it, 82 broke.
looks a long way away to me best of luck
You LONG now then? 🙂 pre US Open
took your advise andy cheers watching 🙂
back to nicks 670?
Going long @ 6670
Nvm 6675 went long
How do you feel when is your entry? Do you look at Stochastic, Macd, or something else? Quite a precise entry, want to learn.
6678 long cheers andy
No Problem. Didn’t quite hit my 6666, but i got out of my Short on the spike down to 6673… Haven’t gone LONG just yet, but watching closely, esp US Markets
Andy saved us. Thanks! Going long 6672
We still haven’t got any clear direction on DOW / SPX so im watching for now. Could be a sharp pull back before new highs next week, or we may see it soldier on higher
Ahwab, could you please tell me what indicators do you use to refine your entries. Your 6675 was spot on today. Please reply.
6700 before close
ahwab wheres your limit 6700 ?
aah just read your msg ignore mine
agree guys 6700 and out
That S&P 1800 and DOW 16000 look scary lol, sht happens.
I was just starting to think surely they’ll go for it today?
Am long from 6670. Thinking of trailing after 6700.
whys ftse such a laggard ?
closed for 2 pips too scary lol
Going to be a slow rise up for the rest of today. Should see some bearishness on Monday =].
Oh sorry Jack 6675 I’m using mobile browser so can’t see whether someone has replied. 6675 has been a crucial area this week for resistance mentioned this a few times throughout the week. Although it is not on my trend lines for today as resistance the fact that that it was significant throughout the week as an area of resistance made me decide to go for 6675. Throughout the week it’s just been up and down around the same area tbh. I see you are doing well though, gl. P.s I do use fib lines/EMAs/BBs but like the DOW which has always something with hundred mark resistance there are sometimes area of resistance that don’t necessarily show with trend lines
Out of curiosity besides following Nick how do you determine your trades?
Thanks for explaining it to me, I appreciate it.
As for me I am trying to identify a certain trend and try to buy after dips basically. I strongly use EMA, draw channels lines and use Pivot points a lot and keep an eye on Nick’s advice. I do like Fib a lot. I am a massive lover of channels and trend lines and sometimes I complicate things that I need help. I study a lot of different patterns of pull backs to get a better strategy of entering into the trade after it (sometimes I take the trend reversal for a pull back and that is a problem). This Friday I managed to take one of the little trades which I finally followed correctly by my rules, which made me happy: I acknowledged all indicators I use, I didn’t seek for anybody’s advice and I held it until it was time to close. (Long from 6684.3 to 6695.3 from 12.38 to 13.25) I wish I always entered by my strategy but not by impulse which happens a lot. Then I make a mistake by adding or chasing a loss. Discipline and acceptance off stop losses is my problem.
🙂 Have a good weekend.
Still in it to get 6700
ahwab you holding in the after hours or you out ?
I just saw your msg … ignore mine.. I think we post em together
Ahwab do you still think we close at 6700 today?
I think we get close by 9pm uk time
Don’t think DOW will touch 16000 today.
Well I got my fill for a short on SPX at 1794… hopefully double top in ay there. If not will add Mon if goes higher. Im expecting a small corrective wave for a few days next week then new all time highs.
Almost 6700, typical slow end to a week. Hopefully we can get 6700 before close, as I expect profit taking @ around 8:30
Good call had it not been ur call I wud have sold mine on loss … Cheers
@Ahwab
Can’t say which is worse the slow market or England vs chile match. Though the S&P is moving faster than the ftse atm…
Ahwab, do you still think ftse will touch 6700
It will be the same as the last few days, rise in the morning and then the dip, so 6700 possibly 6720 initial open on Monday. Unless some bs news over the weekend
Short at 6697 just before close. Vix is showing an inverted H&S which is a key market sell off signal.
Andy, that would have been acceptable on a weekday but over the weekend I doubt it. Gl though, rise to 6700/6720 before the dip to 6675
Roundup –
S&P 500 in strong growth channel. Development consistent with buy signal reported on November Mon 11. Expect 1810-20 within 10 trading days (i.e. by November Friday 29).
A buy signal reported for Dow also on November 11, and a target postulated of 16000 within 10 days of that date. Development likewise in line with signal. Momentum expected to be maintained in short term producing 16050-100 by the end of the month.
Buy signal for FTSE received on November Wednesday 13 but not reported then due to low confidence at the time. Series still in a short-term negative channel from the time of the last peak (let’s say October 30 – November 05), but beginning to pull out of decline. Assuming this process develops, expect 6750-75 by November 29.
DAX is following a strongly positive trend. Increasing momentum expected to combine with latter to produce new highs around 9300 within the next two weeks.
These are just my best guesses at the moment! GL all.
Here’s a graph of the DAX.
http://img7.imageshack.us/img7/193/o1fb.png
anyone doing anything today ?
yep, im off to yorkshire this afternoon. you up to out?
Short 6690 £500 pp …. Trailing stop
Trailing by? 2 or 3 points?
Only trailed till b/e ….. Now waiting for the 100 point slide that I think we’ll see today … £50k target
will you share why you think 100 pips dave?
drop 100 points just in a day today!
waiting to short at 6700 missed it by 3 pips 🙁 looking to long 6664
Long from 6670. minimum stake stop@6660.
nice one sam:)
100 point min pullback imminent
100 points ???? Why you say that ?
Yup ….. Watch
Ftse is such a crazy market-its difficult but im trying to never get attatched to the upside or downside in the short term regardless of long term trend indicators 😮