
Good morning. A nice gentle morning with a decent short off the 6722 followed by a long off the 6690, before all hell broke lose at 12:30 with a decline to 6620. Having found a bit of support there thats the line in the sand though I expect we will see the bottom of the 10 day Bianca at 6599. Usual story for the fall, concern over interest rate rises was the main thing it was blamed on, but its probably just a flushing exercise before a climb in October and for the year end. I don’t think that there was one specific reason for the fall yesterday.
Asia Overnight from Bloomberg
Asian stocks fell, with the regional index heading for a third straight weekly loss, after the Standard & Poor’s 500 Index dropped the most in almost two months. The dollar rallied with sovereign bonds as the cost of insuring debt against default climbed.
The MSCI Asia Pacific Index (MXAP) lost 1.1 percent by 2:29 p.m. in Tokyo, as the Topix index dropped 1.1 percent from its highest close since June 2008. Indonesian stocks plunged the most in four months after the country scrapped direct regional elections. S&P 500 futures added 0.1 percent after the gauge slumped 1.6 percent. Australian 10-year bond yields fell nine basis points after U.S. Treasuries jumped the most in six weeks. The yen fell 0.3 percent and a gauge of Asian credit-default swaps headed for its biggest jump in eight weeks.
About $1.42 trillion has been wiped from the value of global shares this month amid concern Chinese economic growth is slowing and that U.S. interest rates may rise sooner than some investors are expecting. Japan’s inflation slowed more than estimated in August, highlighting the magnitude of the task facing Bank of Japan Governor Haruhiko Kuroda in his bid to spur inflation. Consumer-confidence data are due in the U.S., France and Germany.
“With investors scratching their heads over a catalyst for the decline, many are wondering whether this may or may not be the start of a bigger correction,” Andrew Wilkinson, Greenwich, Connecticut-based chief market analyst at Interactive Brokers LLC, said in an e-mail. It “reminds us just how absent volatility has been during the rally.”
World Index
The Chicago Board Options Exchange Volatility Index (VIX), known as the VIX, jumped 18 percent to 15.64 yesterday, the most since July. That’s 16 percent higher than its average this year. The Nikkei Stock Average Volatility Index climbed 1.4 percent.
The MSCI All Country World Index is on course for a 3.2 percent decline in September, the biggest drop since January. All 10 industry groups on the Asia-Pacific gauge dropped today, led by materials producers and consumer-discretionary firms. The measure is heading for a 1.7 percent weekly loss and the lowest close since May 30.
South Korea’s Kospi index dropped 0.4 percent, while the S&P/ASX 200 Index fell 1.2 percent in Sydney. The Nikkei 225 Stock Average, which yesterday closed at the highest level since November 2007, retreated 0.9 percent in Tokyo today.
Hong Kong’s Hang Seng Index dropped 0.5 percent and is heading for its biggest weekly losssince March, which was also the last time the measure fell for three straight weeks. A gauge of Chinese shares in the city retreated 0.5 percent, while the Shanghai Composite Index was slipped 0.2 percent.
Loss Streak
The S&P 500 reached an all-time high on Sept. 18, and trades at 17.8 times the reported earnings of its companies, near the highest level since 2010. While the gauge is down 1.9 percent for the month, paring a gain for the quarter, it has not had a four-day losing streak this year and has not fallen more than 10 percent in three years.
Data yesterday showed American factories received more orders for machinery, communications gear and electrical equipment in August as an improving economy gave companies the confidence to expand. The number of applications for unemployment benefits increased less than forecast last week.
A report today will show gross domestic product grew 4.6 percent in the second quarter, more than the previous estimate of 4.2 percent released Aug. 28, according to a Bloomberg survey of analysts.
FTSE Outlook
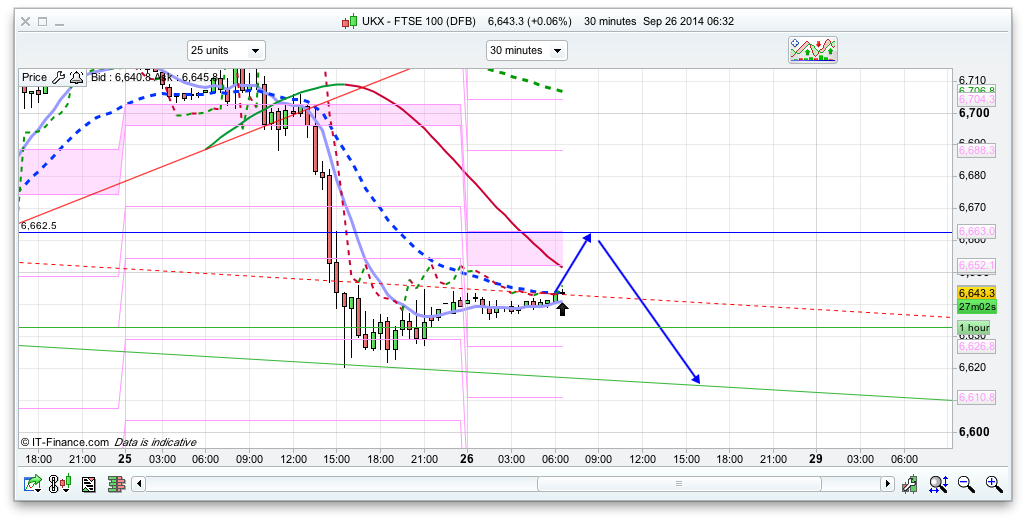
Todays pivot is 6662.5 and I expect us to climb to that initially. From there its quite possible we get further downside, as the bulls need to recover above 6725 to invalidate the decline – as such I think a dip to the bottom of the 10 day Bianca channel at 6599 is the more likely scenario. That said, as mentioned above I do think that they dip is going to be short-lived and we will see a rise again next month. I don’t think the bulls are out of the picture just yet. That said, should 6600 break then the next supports are the bottom of the Raffs at 6577, then 6547, with a possible 6475 (would become likely if 6600 breaks).
Anyway, today…. If that rise breaks through the pivot then the the main resistance levels are 6725, 6760, 6801, these latter two begin the top of the Bianca channels. Might be a big ask for either of them today though! As its Friday I’ll mostly be on the sidelines, but will venture a short at the pivot and a long at 6606.
Trade 1 – 6618 Long – initial stop 6608 – moved to B/E – when price 6624 after trade 2 opened
Trade-2 – Long 6623 – stop 6613
Hi Sue –
Good entries
Any targets ?
I wouldn’t like to imply that the markets would move lower, only that it is the “other” trade that may be worth having in place.
E.g – Short 6617 to 6599 Stp 10 Points
if that area breaks, then 6535+- is next trget. Bear flag in the 4 hourly chart trgt
Good Morning Everyone,
Still not convinced of any longs…I have decided to take a break today not trading but still be reading the comments 🙂
Me too. Very strange behavior yesterday…
Trade 1 – 6618 Long – initial stop 6608 – moved to B/E – when price 6624 after trade 2 opened Stop hit
P&F = 0
Trade-2 – Long 6623 – stop 6613
Hi Sue,
Very brave to make your first trades today! What are your targets? I’m just wondering why you would close a long to then go long again higher up?
Will be getting to grips with this for a while. Now looking at wider timeframes. E.g., FTSE 4 hrs., last signal SELL, 22/09 6787 – 12:00. The ideal entry would have been ≈ 6880, but the system is up > 80 pts. On narrower timeframes, there were good BUY opportunities on 24/09. If this is boring just say! 😀
Jim
– Longer time frames creates a need for a bigger bank & wider Stops…
– If it’s just a general directional indication – EMA’s would seem to fit the bill.
– I have a 30 EMA & 200 SMA on a five minute chart which appears to work quite well. Working on Shorts below 30 EMA & Longs above 30 EMA.
You may find this guys site of interest:
https://sites.google.com/site/prorealtimecodes/indicators
Thanks Hugh, I’ll have a look. Agree of course on the need for proportional stops — 50 pts. seemed to work fine with 4 hrs, in the trial instance at least.
Jim the next buy opportunity, post as soon as possible. Thanks
FTSE/5 mins. BUY 6619 @ 09:55 — but I am not believing it yet!
Too late for that post 🙁
Let’s see how it goes, but did not enter. It was already in 6627
Jim. Can you send me that indicator so I apply in the end of the day daily chart to see how it works ?
I do not use the real time prorealtime charts
Mlawrence
These are my trades
Trade 1 – 6618 Long – initial stop 6608 – moved to B/E – when price 6624 after trade 2 opened Stop hit
P&F = 0
Trade-2 – Long 6623 – stop 6613 still active
Reason for trade = Long Setup Visible on 15 / 30 (& 5&1 min charts )
I have some terrible longs still in place from yesterday?! Not really trading today but i’m going short with aim to make a turn to lower my bulls. That being said the market has gone dead against me every single day this week?! It’s felt more like roulette. So much profit to be made but i get the sense the majority of us have lost this week?
FTSE Tracking US – DAX & CAC Higher
http://s44.photobucket.com/albums/f25/FTSEDAYTRADER/?action=view¤t=cchcagbi_zpsf5a28836.png
** Posted here in error
Trade 1 – 6618 Long – initial stop 6608 – moved to B/E – when price 6624 after trade 2 opened Stop hit
P&F = 0
Trade-2 – Long 6623 – stop 6613 Moved stop to 6621 after placing trade 3
Trade-3 – Long 6630 – stop 6620
Dutch
I agree we may get some bull later…..but that is data dependent on GBP and Sentiment at 1:30 and 3 respectively.
Still think any rally then is a selling opportunity though.
For this morning we will probably see some range bound trading betweem 6610 – 6630 and then see which side of the bed the yanks wake up. Having said that the data releases will drive direction and we are only guessing on direction prior to them.
So have to stay nimble……as always!
Went short on DAX at 9540 as the bounce was to be predicted. There are a lot of political issues going to overcast the data I think. This thing with Russia is potentially explosive and IS threats / terror is high on news agenda too. But you are right, its a bit of a toss of the coin before the data is released.
Trade 1 – 6618 Long – initial stop 6608 – moved to B/E – when price 6624 after trade 2 opened Stop hit
P&F = 0
Trade-2 – Long 6623 – stop 6613 Moved stop to 6621 after placing trade 3 Moved Stop to B/E
Trade-3 – Long 6630 – stop 6620
Will target 6650 to take profits
Sue – I’m just wondering why you close your longs to go long again even as the markets moving in your desired direction? Is this simply to lock in your profits? Eg why not simply go long @6618 target 6650?
Or are you long of 3?
But that break below the 50 ma in SPX, cannot find in the medium term any bounce above that MA in the day after. I only see going even deeper.
Good entries Sue. Where did you learn that lol
Personally when US steady as now we shouldn’t be bullish. When they are crap we can then be more prepared to buy for a rally. I’m very much on the sidelines today.
Closed DAX short 9540 at 9522 as I’m not sure on direction basically like everyone else, except Sue it seems 🙂
MLawrence
I only risk 10 points.
Lawrence – this may help – When market gets to about 6640 or so – I’ll place another long with 10 point stop & bring my trade 3 to B/E
Jim, I was wondering if your indicator is doing the same trigger as the one that compares divergence between the price and RSI ?
When you had that signal at 9:50, RSI was at 37+- (the sweet spot), trigering a buy signal after the divergence between price and RSI below the 30 (which is the best signals for divergences). 80% of time it works. I used to trade with that.
PMS — That was an interesting coincidence. I guess the RSI is a pretty good approach. My current system uses nothing more exotic than smoothing functions but is still experimental and in early development.
PMS – The RSI does work.
I use it (5 Min) but I also like to validate it with the MACD being >4 or <-4 – the only issue is, it does through up trades when the market is on a bender.
I'm thinking about throwing in the ADX to filter out these if I can.
It does need some kind of filter.
That's how I got into the Long/Short positioning.
Going Long on RSI – Stop Short taken down 20 points – Close Short – Let the Long Run up to B/e. Job Done.
I'll post some pix later if I get a chance…
Hugh says:
September 26, 2014 at 11:23 am
PMS – The RSI does work.
I use it on a 5 Min Chart, but I also like to validate it with the MACD being >4 or <-4 – the only issue is, it does throw up trades when the market is on a bender.
I'm thinking about throwing in the ADX to filter out these if I can.
It does need some kind of filter.
That's how I got into the Long/Short positioning.
Going Long on RSI – Stop Short taken down 20 points – Close Short – Let the Long Run up to B/e. Job Done.
I'll post some pix later if I get a chance…
In fact at 9:10 was the first signal with RSI at 36,1. That would be my buy signal at 6620. Then trigger another buy signal at 9:50 and other at 10:00 with a new low 6615
FTSE Tracking US – DAX & CAC Higher
http://s44.photobucket.com/albums/f25/FTSEDAYTRADER/?action=view¤t=cchcagbi_zpsf5a28836.png
Im’ going to post in real time those signals, that I used to trade.
I will use the 5 min chart.
RSI must be at least in >36 after the divergence has been found (but always below 30)
JIm keep posting those signals, to see if they signal at same time as mine.
The stop would be after RSI goes below 30 again after a candle close in the 5 min chart
PMS – The RSI does work.
I use it (5 Min) but I also like to validate it with the MACD being >4 or <-4 – the only issue is, it does through up trades when the market is on a bender.
I'm thinking about throwing in the ADX to filter out these if I can.
It does need some kind of filter.
That's how I got into the Long/Short positioning.
Going Long on RSI – Stop Short taken down 20 points – Close Short – Let the Long Run up to B/e. Job Done.
I'll post some pix later if I get a chance…
Yes it needs some kind of filter, but haven’t found yet other than when you find you are in a trending day
Jim but as any other indicator, it will fail in a trending day.
Trade 1 – 6618 Long – initial stop 6608 – moved to B/E – when price 6624 after trade 2 opened Stop hit
P&F = 0
Trade-2 – Long 6623 – stop 6613 Moved stop to 6621 after placing trade 3 Moved Stop to B/E
Trade-3 – Long 6630 – stop 6620 Moved stop to B/E after placing trade4
Trade 4 – Long 6640 – Stop 6630
Will target 6650 to take profits
PMS – I see what you’re getting at – Like this morning
FTSE 5 Min
8:05 FTSE 6626 RSI 36
Buy.
Divergence Signal
( Sometimes it is just the programming that actually just is too darn difficult !)
PMS — I’m doing some other stuff but I’ll post a graph (FTSE 5 mins) 4-4.30 pm so you can compare signals. Hope that’s OK. 🙂
Last signal FTSE/5 mins. BUY 6619 @ 09:55
** Sorry my typing seems to have missed –
PMS – I see what you’re getting at – Like this morning
FTSE 5 Min
8:05 FTSE 6626 RSI 30
10:00 FTSE 6618 RSI <36
Buy.
Divergence Signal
( Sometimes it is just the programming that actually just is too darn difficult !)
Not so. But will explain further in the coming days, as the signals appear.
Short @45
looks like momentum is for a bit more upside Mlawrence, what’s your stop and target? I think 60 level might be best if one was to go short the FTSE. Short level for DAX 9540-50
Mlawrence, May I know this reasson for this short. just for learning purpose. Thanks
Jim , so your last signal is at 9:55, same as mine…
THe next signal I will post here, and see yours also
Heck who knows if this bullishness will break up further? Personally looking short DAX at 9540 if it breaks that 9590 is the next spot.
Does anyone have a reasonable explanation why the massive sell off yesterday, strong support on the ftse as well..
Jim did you had a short signal at +-7:00 am ? My indicator did not have from the top at 6650 to 6615. Better it had, but only after the 1st was negated. And when these happens I step aside
Hi Lawrence, I had posted a question for you. Much appreciated if you have an answer.
No short signal yet
PMSInvestor
Any buy signal yet?
Hi Senu,
My price this morning was 95-45. Hit 45 so i went short – aim to make 30 points so next price = 15-65. Buy at 6615 go short again at 6665. Let’s see how it turns out.
Thanks for reply. But how do you decide this range?
Jack 2, how are you do on ftse long or short?
I am long ftse from 6630 to 6672
To youhooi and community here.
I am not trading, picking up the pieces. Hindsight maybe helped but not much, it’s a stress relief and pain relief and basically I feel much better now that I didn’t lose the last pants after all (I would have if I didn’t jump out of that long)
Emotions are a devastating power, we are only human.
I may try trading again when I’m ok sometimes in 1-2 weeks. It will be possibly a lonely game after that. I do not blame anyone for my misfortune, however Nick’s arrows didn’t help at all yesterday. sorry Nick if I said something upsetting, I am the one in distress now.
Sue, it hit 6650. are you short or still keeping long ftse?
PMS — I’m running EUR/USD at the moment, but yes: FTSE SELL @ 6638 – 07:25. I’ll post today’s FTSE history later today as promised.
I’m collecting also those with the 1st negate.
Trade 1 – 6618 Long – initial stop 6608 – moved to B/E – when price 6624 after trade 2 opened Stop hit
P&F = 0
Trade-2 – Long 6623 – stop 6613 Moved stop to 6621 after placing trade 3 Moved Stop to B/E Closed at 6650 P&L = 27
Trade-3 – Long 6630 – stop 6620 Moved stop to B/E after placing trade4
Closed at 6650 P&L = 20
Trade 4 – Long 6640 – Stop 6630 Closed at 6650 P&L = 10
Will target 6650 to take profits
Total Profit = 27 + 20 + 10
Great sue. I a 3x long ftse to 6680.
You out ftse now?
Short @ 6660
Sorry, I thought you were him.
Short signal on DAX at 9540 13:25
I’m not trading, only posting, and starting to collect statistics.
No signal yet on FTSE
As i said, this works only in smaller timer frames (5min chart)
and in the close candle
And the sweet spots are hit in the close, these are the best. Any RSI above or below those numbers are not tradable
Short closed @ 6645
Nice, just closed a load at 6635
Thanks Nick. Its your trade after all. Trying to recover from yesterday’s heavy loss.
Back to FTSE — This is just for interest; I can’t realistically post signals as they happen.
FTSE/5 mins. SELL 6648/13:45
Short @6645
Long DAX 9484, lets hope for decent data 🙂
I am just thinking whether good number will also be bad for the market because of interest rate concerns, more downside for now. Lets see.
there she goes 🙂 fly, fly
Looks like a good long Dutch 🙂
or does it? weird
out with a 25 point gain, tempted to go short as market feels weak. But I’m just gambling really so not going to.
Not sure if the spike up is for stop hunting..I haven’t traded today..just checking on the markets and 9540 was the level I was looking to short. Good you took advantage of it.
yeah It only got to that level and I missed it, second time It got to 30 and I went short, got 30 points out of that. Feels its looked between 9470-80 and and 9530-40. However something has got to give!
Ftse very bullish. ftse closing today @6630
Lol scalping here, there and everywhere! 2min/5min stochastic working well.
long DAX 9479
wanted to keep it but out @ 9503, this market is a little tricky. Gut says it will do a classic rally later on but on the other hand looking at next week you got to think that’s the opportunity to sell…
Nice one Dutch, just worried that one of these scalp will end up going one way lol.
yeah be careful, market will jump one way or another before europe close I fear and does not look like the market knows what’s best! so maybe we end flat and leave it till next week
My last signal was on DAX at 9540 13:25. No more yet. Looking also at SPX and GOLD. All signals were positive, for now… going to statistical.
Now will go work seriously on this
GL PMS. FTSE wallowing since 13:50 — difficult to make an honest buck. 😀
Thanks Jim.
Also on DOW
A bit of weak bull today although FTSE has been relatively strong coming off its lows of the day. Interesting to see whether the FTSE can keep its small gains for the day or whether it will finish in negative territory. Key to that I guess is whether the DOW will hold above 17,000 in the run up to 4:30.
hmm to short or not to short the Dax if it gets to 9540? Any thoughts anybody?
If it gets there you can short but I don’t see it getting there..
no does not look that way does it.
How about short on FTSE with a tight stop ??
Not touching the FTSE as not had much joy with it last week or so. Pre Scotland vote it was ‘easy’ to read directionally but at the moment I’m not sure. Several things happening with it I feel and it confuses me as to general direction. Agree more potential for downside though
could you guys state your trades & why you placed it. We are all in the same boat trying to improve. Thanks to Jim Hugh & (pms).
That signal on FTSE is in a thin line. Not yet
The sweet spot for more 60 seconds did not hold.
Now at the close it always more difficult to trust in those signals, but will collect them in other section
Don’t think the DOW going to finish above 17000 today
Been busy most of the day.
1 x Trade – Short at 13:21- 6658
Reason : Overnight Resistance + RSI over 70 + MACD >4 + Dutch’s comment about 6660 !
I did my up most not to come out moved stops down until
I thought DOW had had enough – 14:16 – 6638
have great weekend all, time to spend the money earned on the family!
Here’s the system’s story today on the link below. On reconfiguration 2 earlier trades got changed a little, but they are still in the same ballpark, and the 13:50 SELL was moved up to precede the 13:15 spike. The latest signal is BUY 6649/15:55, but the afternoon has been relatively flat in my view. These are consecutive trades, each closing its precursor. Overall, +54 pts. at the time of saving. One can see, looking at the graph, where the system might have been beaten by sharp human operators like Sue and Senu, but perhaps not bad for a stress-free automated system!
http://i1348.photobucket.com/albums/p736/jmca01/FTSE100DFB_zpsaa4bfdfa.png
Some strength at the auction at the close. On the whole though a quiet day…..but profitable for most here. Well done….time for the weekend…..watching and playing golf….oh and a little matter of the North London Derby….surely the biggest of the weekend.
Monday will be interesting as always! Dependent on geo-political events across the weekend and whether the US can maintain these small gains. My hunch is we will have one more test of 6600 perhaps this month or late next week. Nonetheless happy if I can switch my short anywhere in the 6600 – 6650 mark.
GLA
Hi Guys, any updates for tomorrow and week ahead? Very strange that there is no discussion on Friday after 6pm .
Personally looking for a pullback here in light of the situation in HK, which is down 2%.