
Good morning. Despite Fridays afternoon rally the FTSE still ended January fairly weak. Overnight last night we had yet more weakening Chinese data, manufacturing this time. That certainly won’t be buoying up the emerging markets today, who are experiencing a bit of a currency crisis. Friday didn’t pan out quite as expected, with our long faltering at the top of that 10 minute channel we had at 6550ish, then a really big drop, which to be frank I wasn’t expecting from that point. Coupled with the subsequent rally that drop looked overdone, especially when 6460 broke down. Typical Friday really – expect the unexpected! In the live trading room, we felt it was going to bounce, but it was proving quite hard to pick the level – 6460? 6440? 6430? In the end 6420 gave the support (for no obvious reason). Funny day in the end! Despite rallying back above 6500, we have dropped back a bit, and the bulls will be keen to break that 6510 area for further growth.
Asia Overnight from Bloomberg
Asian stocks fell, with Japan’s Nikkei 225 Stock Average extending its slump from its close on the final day of 2013 to 10 percent, after a slowdown in Chinese manufacturing growth added to concern the global economic recovery is faltering.
The MSCI Asia Pacific Index lost 1.1 percent to 133.30 at 3:11 p.m. in Tokyo, heading for the lowest close since Sept. 5. More than three shares fell for each that rose. The measure dropped 4.6 percent in January for its third straight monthly decline. A global rout wiped about $1.9 trillion from the value of listed equities last month, spurred by weaker-than-expected economic data from China and a selloff in emerging-market currencies.
“We’re seeing the contagion coming through,” said Steve Brice, chief investment strategist at Standard Chartered Plc in Singapore. “There certainly isn’t going to be a crisis but the short-term weakness looks likely to continue for now.”
Markets in China, Hong Kong, Malaysia, Taiwan and Vietnam are closed today amid the Chinese New Year holidays.
Of the 190 companies on the MSCI Asia Pacific Index that have reported earnings since the beginning of January and for which estimates are available, half missed analyst estimates for profit, according to data compiled by Bloomberg.
China Data
China’s Purchasing Managers’ Index was at 50.5, the National Bureau of Statistics and China Federation of Logistics and Purchasing said Feb. 1 in Beijing. That matched the median estimate of analysts surveyed by Bloomberg News and compared with December’s 51 reading. Numbers above 50 signal expansion.
The survey showed jobs and export orders shrinking, amplifying risks of a deeper slowdown as Communist Party leaders clamp down on the $6 trillion shadow-banking industry and interbank borrowing costs rise. A separate private manufacturing gauge released by HSBC Holdings Plc and Markit Economics on Jan. 30 pointed to the first contraction in six months.
Futures on the S&P 500 were little changed. The gauge last week completed a third straight loss, the longest slump since 2012, after the Fed cut stimulus even as a rout in emerging markets spurred concern about the global economy.
FTSE Outlook
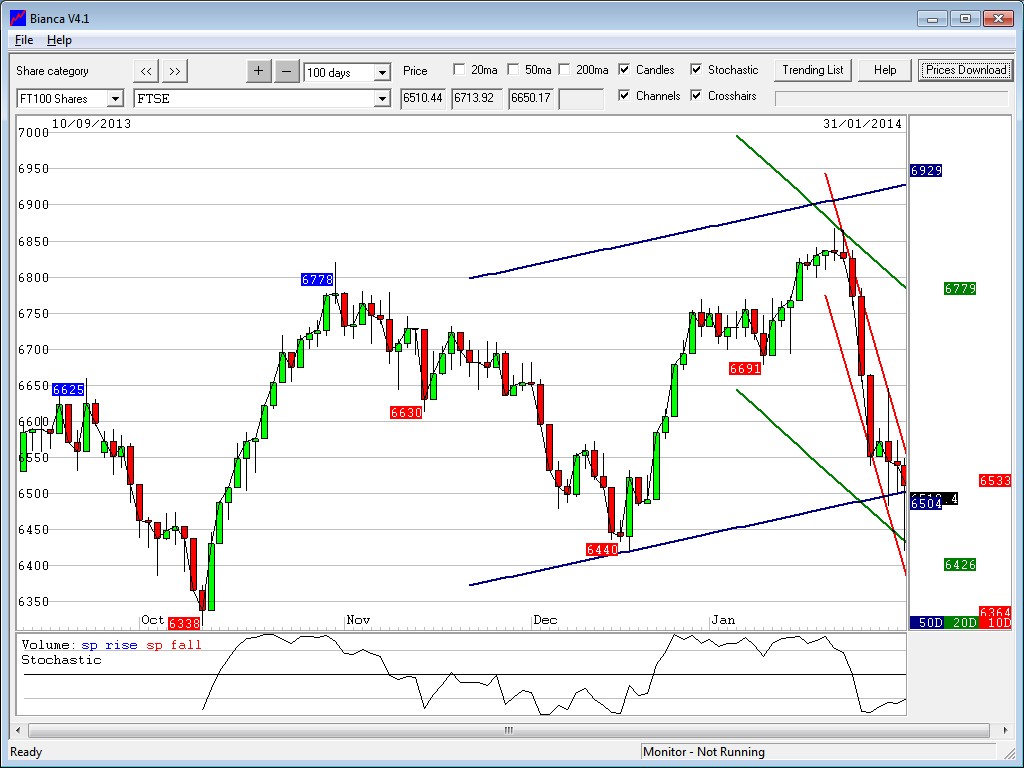
So, Dax and S&P are both looking primed for a dip then rise today, Dax to 9170 and S&P to 1774 (even Dow for the double bottom at 15600), so its probably prudent to say that the FTSE will follow similar lines. Chinese data out last night won’t be ideal for emerging markets, who will be reeling still from last week’s pasting. Upside is probably limited to 6533 initially, being the top of the 10 day Bianca channel which seems to be playing out pretty well at the moment offering the resistance and support areas. Support being 6364 today so pretty low. The 20 day has support at 6426 which could be a good bounce area, coinciding with Fridays low also. Today’s pivot is 6493 so I expect that to be initial resistance, possibly 6510. I am still mindful of the weekly chart where we had the drop to 6200 pencilled in from December last year, a level that could be seen if the 6420 area breaks.
If the bulls were able to break 6510 then 6533 and 6630 are possible upside targets.
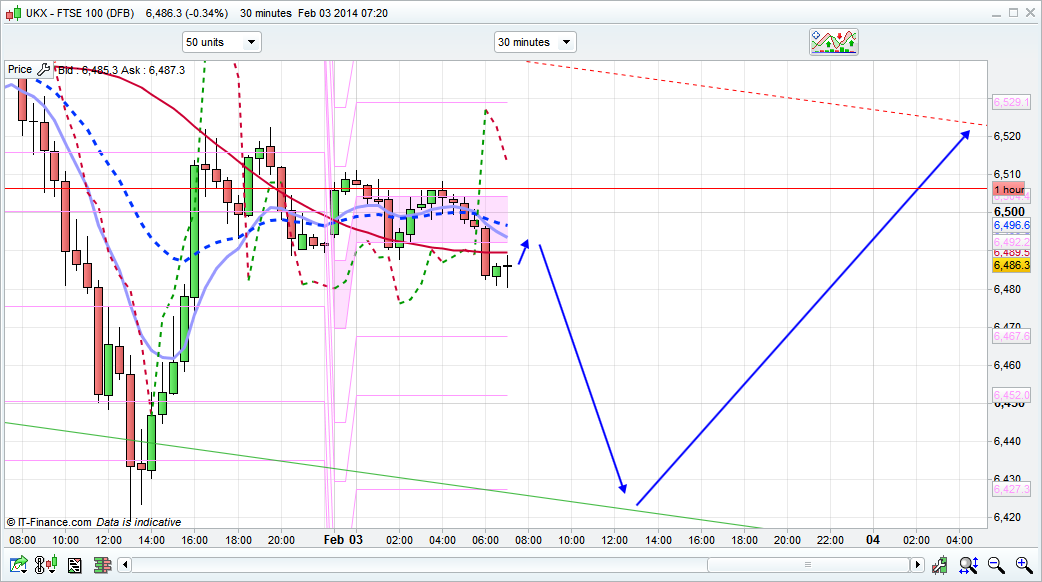
As with the others I think a dip and rise scenario today.
this is is posted very early, I thought the article gets posted 10:30 ?
Don’t bite the hand that feeds you 🙂
What an odd comment..
I was out this morning so treated you all to an early edition!
Please keep up. Ignore that man on top, he probably didn’t believed his luck.
Not that it made much odds, rose quite quickly to start with instead!
short@6532 ,b/e target 100 points!
LONG FTSE 6491 as a hedge against my DAX Short from 9345 (which i intend to hold until 9120 which we will see this week)… One more low before we really buy the dip for rally into March.
why 9120? I got a buy order in at 9158
I see one more lower low, but mark my words i’ll be scaling in at 9160 double bottom. Its definitley going lower after this bounce, will be closing my FTSE longs today for some nice pips and then will likely add to my swing short positions
Sam – can you provide me with your email address please and I’ll send you a chart.
Sorry Javed, I was dragged into something at work. Mail me at mailtosam10@gmail.com.
finally some movements back-but to where i wonder gl guys
Anyway here are my long term monthly predictions for this year. Don’t worry too much about the values it’s more the broad direction……..
6,750
Month FORECAST – 6750 @ 31st Dec Direction Actual
January 6,681 DOWN 6,510
February 6,739 UP 6,567
March 6,811 UP 6,636
April 6,989 UP 6,810
May 6,860 DOWN 6,683
June 6,803 DOWN 6,629
July 6,677 DOWN 6,506
August 6,686 UP 6,515
September 6,479 DOWN 6,312
October 6,670 UP 6,499
November 6,764 UP 6,590
December 6,935 UP 6,757
Javed, intrigued by your long-term projections. Won’t ask you how you do it as I don’t think it would be fair to expect you to give that away. I’ll just ask if your approach has worked for you consistently in the past. Thanks.
No problem. I put them out there for discussion. Yes I have been trading using this method for about 2 to 3 years and in that time it has returned 26%, 7% and 22% of the starting FTSE level. The good thing is that I can back test the results to 1984 (average return – 20%). The model inputs are historical FTSE data, dividend yields, Base Interest rates, key commodity data such as oil and Gold, FX rates and certain political events. Pretty simplistic model but on top of it can overlay charts to get an idea of entry and exit points. I choose not to…..as I tended to lose my trading discipline when doing so. I merely use the direction.
So I’m long till the end of April. Finishes above 6510 – then it was right. However of course have to cover funding and dividend costs, which I forecast will be about 25 point for the quarter…..so my breakeven is 6535.
Hope that helps.
The other thing which I should add is that my leverage is low – no more than 4 times to keep the volatility low. This means that there is a 10% chance of a 50% drawdown…..and less than 0.1% of a complete wipe out. However of course in reality there are fat tails and black swans though!
February 6,739 UP 6,567. what this mean exactly ?
Thanks Javed. A consistent, repeatable method of trading that gives you steady returns is all that matters. You’ve obviously found an approach that suits you. Well done!
Thanks Lal,
It works…..until it doesn’t! So each day you question it, but it’s at the end of the year you should take stock. So I try to monitor my pnl and watch the markets less frequently.
Also try to come on here and post less too…..but I miss the craic! What happened to some of the regulars from last year?
Agree – most things work for some time and then seem to stop! However, there are a couple of approaches that definitely work pretty consistently. You won’t find too many people speaking about them though!
I stop by here now and then but hesitate to post opinions. I think Nick is doing a great job. And this is his show.
Steadily buying LONGS into the FTSE today.
Lets hope Feb is a better month for me!
Just taken a healthy 17.5 points on Dow, Traded: 15667 to 15685.5 didn’t expect it would continue to 15700 . oh. Target was 15690 but hurried to close some profits. Was on b/e.
Twitter : @PMSTrader
The initial monthly forecast was based on the starting point for the year – 6750. On this the model predicted the FTSE to fall in January (to 6681). However it actually fell to 6510. So flexing the forecast it is suggesting a upward market move to 6567 – compared to the original forecast of 6739.
However as I said direction is more important than the actual levels.
So you original forecast was wrong by almost 3%!!!….in financial terms, that is a HUGE error….lol….
Kamikaze trade on Dow. Short 15735, third closed, the rest on b/e.
Cos last time could had held longer.
I just kept 1 lot running for educational purposes.
Closed now, learned a lot.
Closed because I thought that here I would probably tried longs so it’s time to close shorts. No more trades today.
Would have taken long here, but did a lot of trading today. Could be wrong
ye, and it would be
Stop killer looks like
Perfect, as I thought
What a nuisance I expected a long from here. What a fooling market.
Good I wasn’t in any trade.
Gutted. Why I cannot hold? I just physically cannot hold. Just don’t get it sometimes. I rarely win so hold of on those little wins, buy why? This is something that cannot overcome.
I will have to try to learn to hold by closing part of the position like today and let the other one run, today I held more than I would, so maybe next time I will do better. I won 34 points today instead of possible 200+
Gutted.
But on the other hand, in the past I would win 10 points and was happy. So it’s not bad after all. I should feel positive.
Hindsight is a great thing…. You could have held and it could have shot up and you could have been holding on to a large loss… 34points is great
You are right.
6460 looks a good place to buy
yep looks good from here
Jack either learn to be happy with the 34 or trade longer timeframes.
I found daytrading wasn’t for me….for a number of reasons and there is no shame in that. The key is to find a strategy which works for you psychologically.
I am long here
X2WLT do you have a limit? I am also long. Had a short from 6533 today was up about 45-50pips and then got closed at b/e. 🙁
http://imageshack.com/a/img703/5568/r6q3.png 🙂
It’s now happening.
Nice one Jim
Hiten if I get 150 points I will close. If it goes to 6500 I will stop at b/e
How do you work that out, are you talking about an average over more than one trade?
Ignore my last post I think I know what you mean. Can you really see it rising 150 points over the next two days?
Hiten it may take a month or two. I have reduced my stake size as I have been getting burned by the volatility. I had a heavy short and closed at a loss at 6815. What a mistake that was!
Oh I see. Im using IG Index it wouldn’t be worthwhile holding out on there for so long. That’s a bummer, who would have anticipated this massive drop though when 6800 was holding so well.
Adam
Yes it was but the right way….which was nice. As I said I trade the direction not the levels. I have put the levels there as a guide and use it as my budget…..to see where we might end up this year.
Why do people want to buy now? DOW down -250 points whereas ftse is down 50 odd points since open…ludicrous!
Excellent prediction Nick, though I think we will break that 6426 area
And Adam it depends what you mean by huge. My leverage is 4 times only….ie 25% precisely because I know the market will go against me but it’s the time in the market not market timing which is key. Some months I will lose for sure….but on average I will gain in more months…..and the gain will be greater than my losses over the year.
Anyway it’s my plan…not saying it’s foolproof….just a method which suits me for now.
Hiten I’m on IG too. I always trade the qtr ahead rather than the daily
Well call me crazy but im FTSE LONG 6429 & DAX LONG 9145…We are going lower, but expecting some kind of relief bounce into tomorrow, if only to fill the gaps above.
Will DOW reach next support at 14775 ? It’s 695 points below 200 ma.
In 2011 it was 1500 points below 200 ma before bouncing to all time highs
Should have stopped trading after lunch. 🙁
15150 should be next level to watch. Before Friday we will see it.
At this rate, probably 15000 on cards!
… Well there will be no more buyers after today, even if there are sellers, can we draw a line under this carnage?
A few weeks back we’d have given anything to be in at these prices. The Dow is down 7%. It’s time tomstart loading up for the new highs in my opinion even if we drop a little further
When will this reverse ?
Any ideas ?
At least till Friday NFP the Markets will go nowhere. More downside .
And FTSE holding. I stopped looking at these índex . It his independent market. Does not follow the majors
Can’t rule out a test of the 6320 zone on the FTSE cash…