
Good morning. Well we got the rise to 6460, and a little bit further to 6475 which is now initial resistance. As expected the Fed has stopped the QE program, markets initially had a muted reaction, so i closed the short from 6460 for a few points, only to see it dropped to 6430 later on. Still, with big news sometimes its better to be out wanting to be in, than in, wanting to be out! Since that drop to 6430 it has bounced back and actually looks like we will get a bit of a repeat today with a push up to 6495 where there is the top of the 30 minute channel, and the Bianca 20 day at 6506. Interestingly the S&P dropped off from the 1991 area but 11 points and has stayed down. As per yesterdays email we were looking at 1986, possibly a spike to 2000, so that 1991 might be it for the moment… today will reveal all!
Asia Overnight from Bloomberg
The dollar climbed to a four-week high after the Federal Reserve judged the U.S. economy strong enough to end its asset-purchase program. Metals and oil fell with Hong Kong stocks.
The Bloomberg Dollar Spot Index gained 0.2 percent by 3:08 p.m. in Tokyo, with the euro weakening 0.3 percent and South Korea’s won leading emerging-market currencies lower. Gold dropped 0.4 percent and nickel slumped 2 percent. West Texas Intermediate crude oil slid 0.4 percent. Hong Kong’s Hang Seng Index dropped 0.5 percent after its biggest two-day rally in seven months. Standard & Poor’s 500 Index futures were little changed.
The Fed cited job gains in its decision to wind up the unprecedented bond-buying program, which has suppressed U.S. yields and fueled capital inflows into emerging-market assets. Officials retained a commitment to keep key interest rates low for a “considerable time.” An update on third-quarter U.S. gross domestic product is due today, and euro-area confidence data is scheduled before inflation tomorrow, when the Bank of Japan will report on monetary policy.
“The U.S. currency is back on its uptrend,” said Imre Speizer, a markets strategist at Westpac Banking Corp. in Auckland. The Fed statement “was a hawkish surprise to the market.”
The Bloomberg Dollar Spot Index, which tracks the greenback against 10 major currencies climbed to 1,071.85, the highest since Oct. 3. The gauge added 0.6 percent yesterday, snapping a three-day drop as the end of quantitative easing spurred traders to boost bets that U.S. rates will be increased next year.
Yen, Pound
Fed officials said in their statement that “solid job gains and a lower unemployment rate” since their last meeting in September allowed them to end quantitative easing by the end of this month. A range of indicators suggested that “underutilization of labor resources is gradually diminishing,” modifying earlier language that referred to “significant underutilization.”
The yen fell 0.2 percent to 109.09, and touched the lowest level since Oct. 7, and the euro slid to $1.2598. The pound bought $1.5973, a two week low. Hungary’s forint and Turkey’s lira retreated at least 0.2 percent.
South Korea’s won weakened 0.8 percent to 1,055.6 after climbing the previous three days.
The S&P 500 lost 0.1 percent yesterday. Concern that Europe is slipping into a recession and China’s economy is slowing just as the Fed ends bond buying sent the U.S. gauge down 7.4 percent through Oct. 15 from a record high reached mid September. The gauge then rallied 6.6 percent through Oct. 28 after Fed Bank of St. Louis President James Bullard said officials should consider delaying the end of QE amid the global concerns.
U.S. GDP
The value of global equities fell by more than $680 billion this month after slipping $1.8 trillion in September, data compiled by Bloomberg show.
U.S. GDP probably rose an annualized 3 percent last quarter, after expanding 4.6 percent in the previous three months, according to the median of 87 economists’ estimates compiled by Bloomberg before today’s data. Euro-region economic, industrial, consumer and services-sector confidence reports are due today, while Germany will update its jobless rate.
Yields on 10-year Treasuries fell 1 basis point today, paring yesterday’s two basis point, or 0.02 percentage point, gain. Similar maturity Australian government bonds paid 3.33 percent today, up four basis points .
Brent Oil
West Texas Intermediate oil slipped to $81.87 a barrel after gaining 1 percent yesterday on signs of slowing growth in U.S. crude inventories. An Energy Information Administration report showed stockpiles rose 2.06 million barrels in the seven days ended Oct. 24, following a combined increase of 21 million in the previous three weeks.
Brent crude dropped 0.1 percent to $87 per barrel in London. It reached a two-week high yesterday after OPEC’s Secretary-General said the recent plunge in oil prices doesn’t reflect the balance between supply and demand.
Hong Kong’s benchmark gauge closed at the highest level since Sept. 24 yesterday. A measure of Chinese companies in the city slid 0.9 percent today after a 4 percent gain through the previous two days. The Shanghai Composite Index climbed 0.9 percent.
Housing Support
China will support consumption in six industries including real estate development as growth in the world’s second-biggest economy slows, the nation’s cabinet said after a meeting yesterday. China will “stabilize” housing-related consumption and relax conditions under which tenants can use their provident housing funds, the State Council said in a statement. It didn’t provide further details of planned property-support measures.
Gold slumped to $1,206.74 an ounce after sinking as much as 1.6 percent to $1,208.50 last session, its lowest intraday price since Oct. 8. Silver retreated 1.2 percent. [from here]
FTSE Outlook
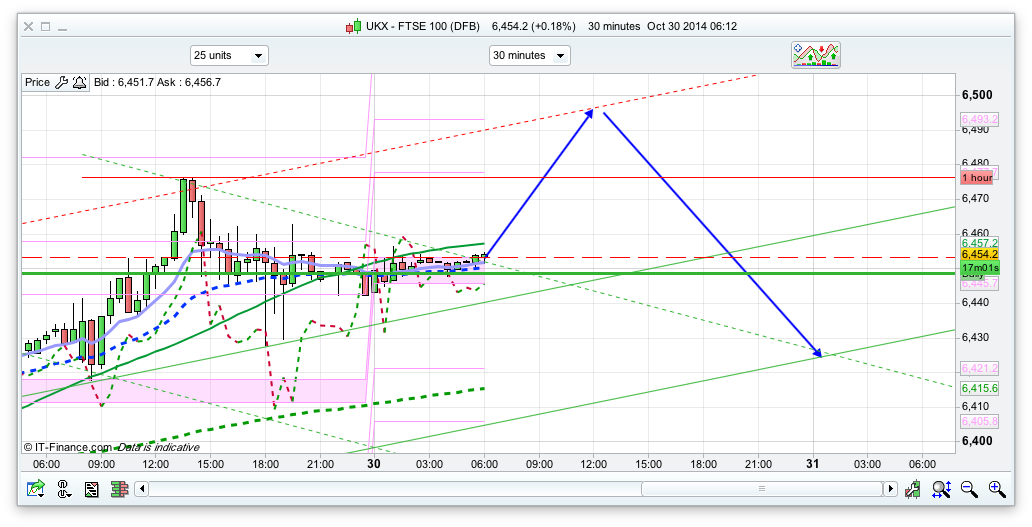
That short didn’t go quite according to plan really though it did get a few points on the board. 6471 was the top of the Bianca 20 day for yesterday so dropped off a little bit from there before bouncing back. Initially today it looks like we will get a push up to 6495, and the 20 day channel is 6506 today. A short around this area could be good, and we have had a decent bounce from the recent lows, with the 10 day channel on both Raff and Bianca now heading up, but encountering the longer term resistance around 6500 (6488 for 50 day, 6506 for 20 day). That said the S&P struggled to hold onto that rise to 1991, so if that starts to drop then it will drag the others down. The dollar (cable) has also strengthened , dipping below the 16000 level which could weaken the FTSE if it falls further.
Initial resistance is at yesterday high at 6475, if broken then we should reach that 6495 level. Todays pivot is 6444 so we have initial support there, and a level that we are not actually far above as I write this, so the bulls will want to be quick out the blocks, as a break below the 6436 level risks a dip to 6415 and 6381 where there is the bottom of the 10 day Bianca and 20 day Raff. If 6495 were to be broken (unlikely I think) then 6534/6547 is a likely resistance level.
Support so entry levels for a possible long
- 6444 daily pivot
- 6436
- 6416
- 6381
Resistance so entry levels for a possible short
- 6475
- 6495
- 6506
- 6534
Dear lord ignore nick completely!!!! and do a serious dip and rise
Lord granted half of your wish 🙂
lol hopefully we get a rise later
hopefully, when US wakes up FTSE should bounce from 70/60 (S2).
Agreed. Can see S&P’s getting to 60 then yanks waking up and booking their profit.
Next 6416 and 6381 🙂
Long @ 6413
PMS, come back and tell something to FTSE 🙂
Hi Guys
A late posting of a sell signal.
But it has given 2 targets Both at 6366
First time software has done this.
?? Could this be a Buy Signal from there ?
Not sure – But worth looking at when it gets there,
& ocourse If it gets there.
Hi RC, what is the level you got this sell signal?
Hi Senu
Its too late for the signal to be relevant to anybody.
But for your information – it came at Sell – 6479.
But really – for you the relevance – May be
the target figure of 6366.
Running system on FTSE 3 mins —I got sell @ 6462/08.15. A bit more cautious than RC’s signal. Data input from yesterday morning.
Morning Jim
When up on the news and everyone’s realised things are still pretty shit. I’ve personally been going short all week highest @6480 this morning. Now closing them all on 30 point falls.
PMS —
ProRealTime says: “For the moment, the progress bar and the optimization report window are currently not loading during the execution of your ProBacktests, you’ll have to wait until the very end of the calculation to see the results. The time naturally depends on the number of variables, intervals and then iterations you’ve set. This is a temporary situation that will be fixed as soon as possible.” No doubt we’ll notice. 😀
THanks Jim
although expected and long temr trend down, looking at a 2hr chart for me on the DAX we entering support and good long option 8990 level, with a target of 9045
longs getting chopped out.. Is it bear coming out ?
Have sell signal in all indices, except FTSE. THe strongest are on SPX (1972.3) and DAX (9003) at 10:00am
hmm I wrote about this happening yesterday but get the feeling this is getting overdone a bit. What are “good” levels for the FTSE anyone?
70/80 – may be. I am short (small stake) from 6480 this morning will close at 70 and go long.
Was looking to place a order at 1976
Strong sell signal also on FTSE now
PMS, is this going back to 6070?
do not have any clue. I do not have any targets. Only sell and buy reverse.
Sometimes these reverse signals are temporary, only indecision, mainly when they are weak signals, like DOW.
the automatic order was at 6392.
But the one I trust more is still on SPX and DOW and DAX. These are the most trusty for the moment, as FTSE gave me in the past some bogus signals with changing in the last minute variables. And also because,except for FTSE, all other indices give a bunch of points after a signal is triggered giving much time for a stop at b/e… FTSE as a snail in more difficult.
I think I miss the party this morning. Awoke up very late. All signals were there already after I saw it… so no party. Only the autotrade doing the sells
anything on the DAX currently (apart from your sell signal at 9003 this am)? much appreciated as I still think this DAX is going to bounce a bit later on. guess the most important one is SPX though
nothing… my candy indicator still in strong sell.
Fresh sell @ 6384/11:39.
1972, 16958, 9003, 6392
PMS, what are these levels, have you gone long here?
no. these are the sell orders for the autotrade
This is why, when I saw the auto-sell order on SPX, was trying to place a manual order at a higher level, in this case 1976 (only reached 1974). Still with some lack of confidence, now and then in my system. STarted only in October 1st
1976 was closer to the confluence lines when the reverse can occur and less point loss, if a reverse could occur. Is trading yet at afterhours. SPX only opens in a couple of hours.
Thanks PMS 🙂
Hi guys
First time posting
Will this fall continue in the ftse or has it reached a resistance at 6380-6390 mark?
For the newbies…I do not use stops, only reverse sell/buy
in the autotrade ofc. The manual, I’m more flexible, like stop at b/e after a while.
now the reverse on FTSE can occur above 6420 with a close bar
SPX only above 1976
candy indicator on DOW saying, stay out of the market.
Looks like Data out of US is good – So is Good news to good to Markets or Bad?
without QE is good. Now things start to be more logic
One thing I learn from my system, since start of October…if I do not have strong signals on both DOW and SPX at same time, for a buy or sell, it’s better to be more careful. I had some of that in the last weeks. DOW today was the weakest
PMS, FTSE indicator reversed?
at 14:00 will tell you. Now is reversed, but confirmation only 14:00
ok will watch 🙂
No confirmation, yet. Now at 15:00 will take a look again. But I will be out so, no update…maybe later
DOW is the only one that reverse to buy (17039). In line with a perfect read and interpretation on the system. A loss of 83 points on DOW for that reverse, if I had taken the sell with candy indicator saying to stay out.
Senu that indicator is a bonus to my system, which I take in account when placing manual orders.
But nevertheless the automatic trade can deal with those losses… since start of October the gains are amazing if I had used the automatic trade
good one mate.. i didn’t expect it to close below 20
patience is the name of the game
Sam, what is your target for Gold short?
Between 1100 – 1000 by end of dec. Based on world economy improving, more good data out of US, USD gets stronger and xmas rally will drive down gold, but will be bumpy though.
Thanks Sam, good one 🙂
PMS, your candy indicator was rite, dow flying
DOW. Last buy signal was at 16529. Oct,23. Today it was closed at 16958 (reverse sell) and open again at 17039(reverse buy)
Oct.23 candy indicator bull
hmmmm… have to learn a lot.. GL mate
forgot. Today candy indicator bull(17039)
Senu that candy indicator is only a read of a combination of exponential moving averages. But it has also some false signals, if you do not interpret it right.
I’m going to wait till 15:00 pm here and post it. Then I have to leave the desk
I think, FTSE is reversed. 20ma 5 min is still holding
since 11:55
Senu, buy all indices…
Senu I use my system as a barometer of the markets. It helps me a lot…
I was blind, now I see…
lol… ok.
FTSE-4 hrs. — For interest — Got a SELL signal yesterday @ 6421/00:00.
http://i1348.photobucket.com/albums/p736/jmca01/FTSE100DFB_zps33bea99c.png
S&P 500-4 hrs — SELL Oct. 29/1983/12:00
Jim, is this not too late to post this ?
Gl mate… I have to leave now
Arkad, Lord granted you 2nd half of your wish too 🙂
Nick’s chart worked upside down today 😉
Annoying too, had big shorts staked at 6495 and only a small one at 6475. Bottom of 10 day Bianca at 6381 held well though!
Jack, what have you decided on your dow short?
Sorry Senu, 🙁 I thought these 4 hr. signals would still be of interest. If correct, they capture trend at a crucial point.
S&P going for 2000
and more I think..
Let it go….Let it go…… 🙂
I love this the high we go the better the fall when the music stops and there are no chairs left BANG your on your Ass……….
nelly, earlier you only had S&P limit upto 1985-1990, how come now moved to 2000?
1900
Hi old chaps
😀 look at those indices. I was blind, now I see…
FTSE in the daily chart close, it may have RSI above 50 for 1st time. That would be a strong bull signal
Time to sell again?
beat wait till 2moz ??
My core indicator, that’s what make my autotrade system work is doing very well, since OCT.1st
The candy indicator (Combination of exponential moving averages), works also reasonable well and helps me with the decisions, when or not to enter
P,,, is this on ig ?
no IG. My own recipe
Short DAX 9115 with a 9035 target as the trend upwards from last few days for me has reached the end and I now see a downward channel emerge on a 2hr chart
interesting. I was looking at it and I see a V-shape. Now at the most it could consolidate here and a little below to form a bull shape pattern (bull flag, etc)
FTSE has the same pattern
you looking at a 2hr dax chart is it?
think this is a good trade Dutch but for friday morning or over nite
yeah it might like it did yesterday go up a little more before it drops but I rather get in there if I think I see where its going. Might average it a bit as the evening progresses.
or I am a complete idiot as SPX just broke 1991 so 2000 it goes..
will short DAX if it gets to 9150
dow smooth ride 🙂
08:51:56 TRADINGDATA2: (driley) Month end .. mutual funds jamming money into stocks
yeah but thats only tomorrow!
close enuff pal must be mad to buy this
ofc, you had to buy when the signal appeared. Not now… it’s too late.
Senu, did you take any of my signals at 15:00 pm ? :D:D
My system took all, without looking back
Good rebound but again the FTSE looks sluggish as it dips first before the US pulls it up.
Still looking good to finish October above 6500 which won’t be too bad…….but concerned what will happen when US markets dip.
6800 by year end is still on the cards before the bull market comes to an end next year.
True Javed, am bit worried now with this rally!! Am sitting on nice profit but it can all change if spx dips. I don’t have patience to hold these longs till end of year.
Wow what a rally!! Just setting trail stop in all my longs. Hugh profit in account. 🙂
Javed, FTSE within touching distance of Month Opening level 🙂
Yes Sam, amazing rally on the back of Japan’s stimulus package. Nikkei up nearly 5%! Wow……what would we give for a 300 point move in the FTSE?!
Anyway FTSE now down only 1% for the month……..so my trade not looking too bad……and likely to finish positive by the end of the year.
However well done to any who caught some of the 1100 point swing in the month….
Javed, do you reckon these markets are going to up further before Bears pitch in. I am sitting on good profit and ponding if I have to take risk of closing by end of today or just book the profit and take off.
am sure when FTSE opens at 8 AM there will be Bulls stampede, may be close at the end of stampede?
Yes Sam , of course that is the million dollar question. Personally think today may be the day to reduce some of your positions and book your healthly profits…….but keep some of your positions open for the run up to Black Friday and the inevitable Santa Rally.
The key to the market is to stay alive to fight another day – time in the market rather timing the market. For instance take my trade – long at 6625……it went down to below 6100 within a few weeks and so back up to near break even.
Good luck.
Sure Javed, thanks for your advice. 🙂
& then use some of your realised profits to buy the dips……..or should that be buy the f’kin dips!
Lol 🙂 Am expecting a Bear run between now and xmas rally, thats when i will again buy for end of the year/early jan.