
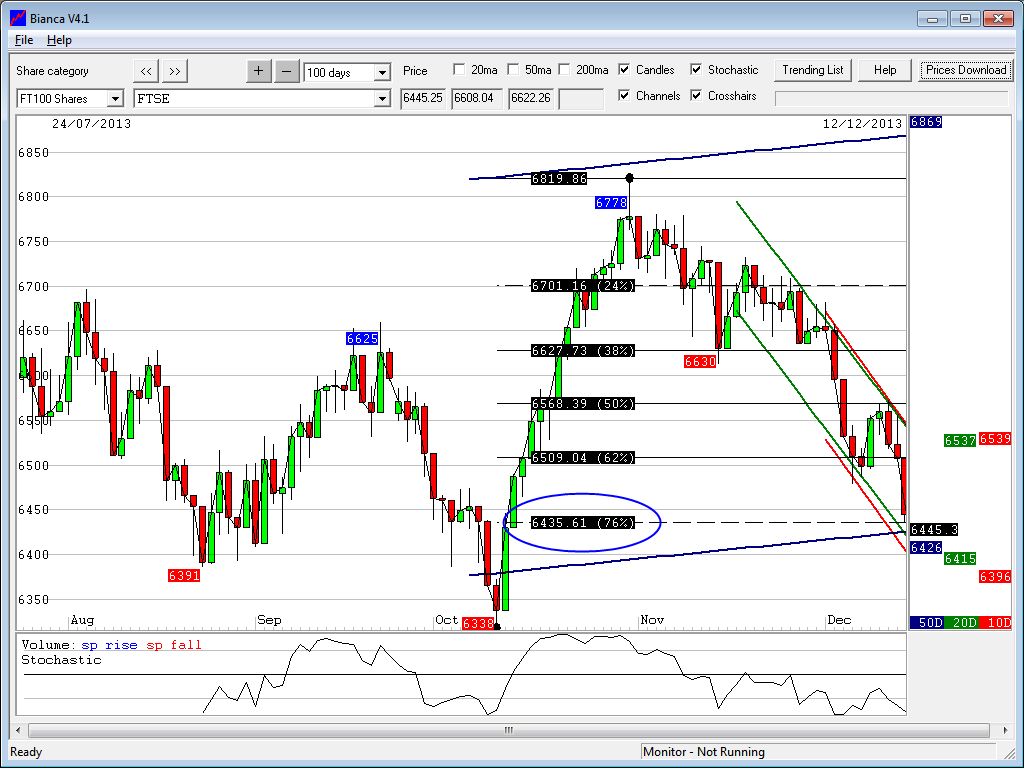
Good morning. If we get a Santa Rally this year you just know its going to suddenly appear, but probably after the Fed meeting next week. unfortunately the long yesterday off the 6470 support area soon gave up the ghost and we dropped down to the 76% fib line on the Bianca chart you can see below. This is from the most recent lowest low to the most recent highest high. Without wishing to tempt fate, despite a slight overshoot to 6425, the FTSE has bounced up a little from there. That level also coincided with the bottom of the 20 day channel yesterday. Bad jobs news yesterday saw a rise as it was seen as good, as it means tapering might not come that soon. Be good once there is a committed timetable and future for tapering, however, I still think it’s a couple of months away.
Asia Overnight from Bloomberg
Asian stocks fell, with the regional benchmark index extending its second weekly loss, as improving U.S. economic data boosted bets the Federal Reserve will reduce stimulus as early as next week.
The MSCI Asia Pacific Index dropped 0.4 percent to 137.59 as of 2:03 p.m. in Hong Kong, with nine of the 10 industry groups on the gauge declining. The measure is heading for a 1.4 percent drop this week. Japan’s Topix (TPX) index lost 0.3 percent and the Nikkei 225 Stock Average advanced 0.4 percent as the yen touched 103.84, the weakest since October 2008.
“With the prospect of tapering only days to weeks away, the global effect is starting to ramp up,” Evan Lucas, Melbourne-based market strategist at IG Ltd., said in an e-mail. “The unwinding of unconventional monetary policy is a good thing in the long term, however it will cause short-term vibrations.”
The Topix rose 44 percent this year through yesterday, the most among 24 major developed markets tracked by Bloomberg, amid unprecedented stimulus by the Bank of Japan in support of Prime Minister Shinzo Abe’s efforts to end 15 years of deflation.
S&P Futures
Futures on the Standard & Poor’s 500 Index rose 0.2 percent today. The measure fell 0.4 percent yesterday after a report showed retail sales rose more than forecast in November as Americans bought cars and took advantage of discounts going into the holiday-shopping season.
A separate report indicated applications for unemployment benefits jumped last week from an almost three-month low. The Bloomberg Consumer Comfort Index advanced for a third straight week as Americans grew more optimistic about the economy.
Fed Meeting
Data last week showed the U.S. jobless rate fell to a five-year low and the economy expanded in the third quarter at a rate faster than initially estimated.
The Fed will probably start reducing its $85 billion of monthly bond purchases at its Dec. 17-18 meeting, according to 34 percent of economists surveyed Dec. 6 by Bloomberg, up from 17 percent in a Nov. 8 poll.
The U.S. House passed the first bipartisan federal budget in four years, which would ease $63 billion in automatic spending cuts and avert another government shutdown. The legislation now heads to the Senate. The House voted 332-94 for the $1.01 trillion compromise budget crafted by Senator Patty Murray and Representative Paul Ryan, the chairman of a special bipartisan panel. President Barack Obama said he’ll sign the final measure.
FTSE Outlook
The declines all look a bit stage managed (pure conjecture on my part) rather than fast rapid declines that would get the media in a froth and the BBC an excuse to get their big red arrows out again. This way we have a correction before the rally, and reduces the “overbought” status that everyone was talking about when we were at 6700.
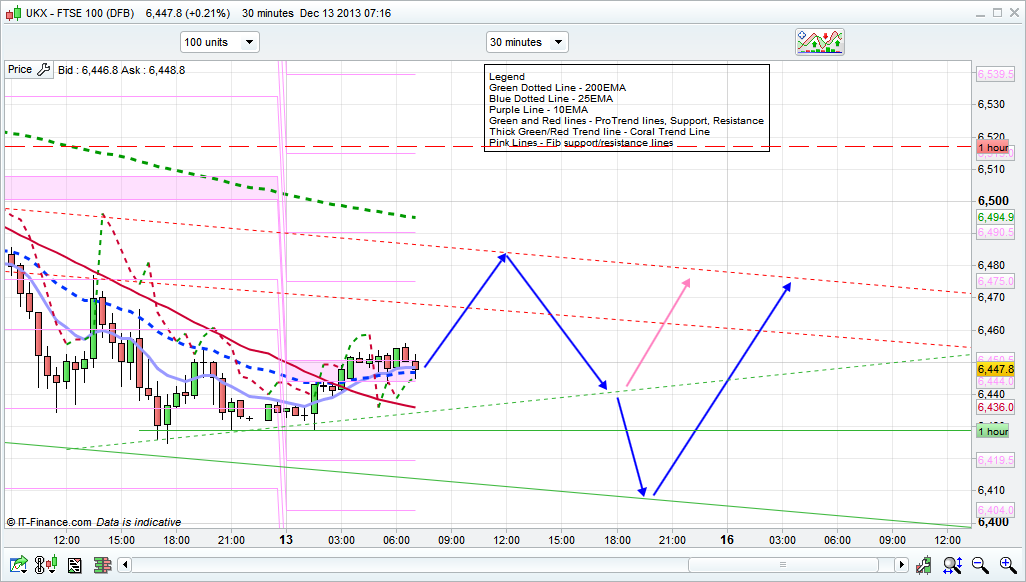
We have a fairly decent 30 minute channel at the moment, which has resistance at the 6480 area. Any move above 6480 could get to 6517 but with the trend down and buyers unlikely to be rushing in ahead of the fed meeting I think a dip from that level is more likely. I wouldn’t get really bullish till 6573 is broken, which is the top of the 10 day Raff.
I have plotted my preferred plan with the blue arrows, though its possible that the pink one plays out if that rising support line holds.
Thanks Nick. It would be good to know if you’re in or out of the market at the mo?
Long at 6439
Exactly on the midpoint of the whatever-its-called-channel….. 🙂
Thanks and good luck. Worth a punt at this level….with a tight stop
Agreed! Always tight stops, assuming you enter off recognised levels.
nick out of interest what amount of stop do you have in points 10,15, 20, and do you always trade with the same amount of stop or do you vary your stance
I vary it to be honest depending on what time frame I am going off. day trades using say the 30 minuet chart will have smaller stops than a swing trade off a daily trend line. Anywhere between 12 and 35 points generally. I often set the stop after entering the trade as well. They seem to get “hit” less often doing that, especially on spikes. Maybe just being overly cynical though.
Glad you are no the only over cynical one, Nick. I’ve adopted the same tactic too – glad its not just me… lol 🙂
Think you have to be for this!
… sometimes it feels as if you are playing roulette and spinning twenty zeros in a row… and you are thinking… what the !”£$??!!… how can that be possible??!! … and thinking you have been robbed lol 🙂
Sometimes I think we all have our own ‘version’ of the market 🙂 , but maybe that is too cynical 🙂 One thing is for sure – the market wants your money – and it will pull out any ‘stop’ lol 🙂 to take it ……. 🙂
… “prices are ‘indicative'”… 🙂 hmm 🙂
I’m still short on the FTSE, and long on CAC and Dax… Hedging
All world indexes are in daily down trends, so trying to pick bottoms is differcult.
If your bullish better to long the Dax and hedge with FTSE short…
Different strategy Jasper. Im sure it’s equally valid, just different. Trading off a support level after a big drop leads to small losses much of the time (assuming a tight stop) but generates big gains on the bounce. Again assuming you take them….
Long @ 6445
booked ..
… congratulations 🙂 well done….. 🙂
lols .. thanks 🙂
… you’re welcome… 🙂
Short @ 6456
…guaranteed to rally !!!
Well FTSE is hovering that 6450 level, No understanding of the meaning of that, unless a huge spike coming up
yes, looks like it’s setting itself up for a small rebound today
Hi Nick
I just wondered, not long ago you were so confident that the tapering is not going to happen till Q2 at the earliest but now you only talking about couple of months. What’s change???
Anyone feel like going out and finding some paint to watch drying instead of this snore?
Trade the daily and weekly. Use the free time to study charts, keep up with the news and do other things.
Not suggesting that it is any easier to make a living but at least you can have a life!
Trade safe
6450 seems to be holding
I want it to start putting some distance on 6450 or we will easily crumble to 6400 soon.
I think you’re right
Nick, are you still into your earlier long @ 6439?
Just shorted Twitter at $57.60…bloody touched $58…rose like a rocket straight out out the door….lol…another highly manipulated stock…a ‘darling’ of the hedge funds to kick around like a football to make money…IPO was some $52…then got shorted down to $38 fast..now touched $58 today!!
$26 for the lucky ones. 100% ROI for the lucky ones.
GL Ray
6435 gone ?
Thanks NR169…always value your advice…sensible as always..:-) Just closed it for a small scalp of 57 cents..closed at $57.03…was oscillating in and out of profit too fast…clearly algorithms at work..just looked now touched $56.40..left 60 cents behind..never mind…as the Wall Street mantra goes..’You eat what you KILL!’…I need to eat regularly..albeit small meals…forget the ‘feasts’..as they say ‘bulls make money, bears make money, pigs get slaughtered’! 🙂 So small trades for me…like ftse yesterday…and euro dollar short from other day…$1.38 short gave the expected 70 pips yesterday…today Twitter…also am DIVERSIFYING…trading everything EXCEPT DOW…this way when ftse is flat like today I can hunt elsewhere…also keeps mind agile and nimble…always hunting for new opportunities and thereby reducing risk exposure due to risk of boredom trading and stagnant stocks/forex/indices. Playing safe…
Twitter scalp was just observing 1-15 min candlesticks, 15 min for direction, smaller timeframes, 1-10 for watching and timing exit…Intertrader use a wide minimum stop loss for Twitter otherwise would have been okay for bigger gains snd trailing.
Ray. I prefer the longer term trades. Dont know how you guys can concentrate for so much time. The only thing I disagree with you on is “Averaging”. My mentor taught me to respect stops and to plan and place them ahead of the position. This has saved me so many times, lost count over the years.
Anyway it looks like we have eliminated the small C@ck large stake posters for the moment.
Keep up the fight
anyone shorting ftse for the train smash into the close ?
Yep Short from 6443
Thanks mate 🙂
Totally agree with you on avoiding the dangerous practice of ‘averaging down’ to HELL!…I try to avoid it as much as possible..but sometimes do so..at very very small stakes…lost my shirt back in January shorting the dreaded FTSE from 6000…touched 6365 about 3 weeks later…averaged down to about £68pp ..in the end gave up..took HUGE losses..just under 10k.
Regards the ‘big players’ hope I have smoked them out…but it did my head in to be honest..hopefully they will be kept at bay…if another of his ilk comes on, I am just going to ignore them, as it is unnecessary to give them the ‘oxygen of publicity’…just ignore and move on!! All the best…:-)
Very rare year to see no downside for the open. I think a lot of players will have taken hits in the first few months of the year. I was short at 6100 at £5pp. I was looking for 100 pips so set my stop at 6150. So only £250 lost.
Been doing a lot of analysis of FTSE monthly ranges. Have analysed 20 years or 240 individual months. Now analysing DJA 60 months so far. Some interesting angles emerging.
Are you full time like me?
i never average down on a losing position.
ONLY do it on a winning position, even then i make sure that the stop is at break even (at times take a minimal loss).
So my thinking was many of the investment management firms will be squaring off books to lock in year end profits, so I placed a short this morning at 6439. Surely I’d make an easy 39 ticks, but no I get stopped out at 6460. Just can’t seem to get this right.
Waiting for the long term opportunity. Going to pile in a couple of longs possibly from 6300 and below. This will go back up eventually. I’m putting my money on it 🙂
I do not like indeed this. I’m seeing a lot of it. 6300-6350 and so on. It seems a target already as a certainty.
SO everyone is going to be rich. Just bet everything in a short and target a humble 6350
Yeh that’s the idea. I’ll either be in Thailand or staying home for XMas.
Nick suggested it could go as low as 6175. Other analysts say 6250-6350. But all of them agree on one thing – their targets are conditional on failure of key support. Right now, 6435 remains in place so the drop is far from a certainty.
Sorry NR 169, just left desk…done for trading for the day…full time..yes…some days don’t trade when awaiting big news like next week FOMC Wed…however, from next September planning to do it part-time, back to some part-time legal work…gives it a balance..some days you get bored stiff with no human communication…very lonely job!! Hence why I sometimes post such long posts…and rants…the stress shows!!! Like last week, took all my anger on Sarj…afterwards, felt a bit guilty…I was over the top…should have let it go..a bit of an ‘overkill’….hopefully lesson learned…lol..
Thanks for the tip on the EUR/USD, Ray 🙂 Much appreciated 🙂
… especially at this time of year lol 🙂
No worries mate..glad it worked for you 😉
££:-):-)££
My apologies for angering u ray. I learnt my lesson
FYI I did make lots of my last trade!
No worries Sarj, I posted one earlier to you as well at the bottom, no hard feelings, sorry for being rude and a bit pedantic, the stress of markets sometimes makes my brain go fuzzy. Well done if you had a good outcome 🙂
Apologies to you to Raymond 😉
Other suggests 5970 with a elipse shape pattern 😀
Happy days if you’re the right side of that trade 🙂 But to get there, key support has to fail which is the point I was making…..
True that and thanks for your replies. I shall sit on my hands for now and wait.
Weekly chart continues firmly #FTSE
and Falling wedge (bullish)
Charts in Twitter
FTSE is brewing another base as last week
im, more bearish than ever on ftse.
I can say upto 18th ftse will be in red. I think today was an opportunity to close ur longs to minizmize losses.
No way, Why you say that ? NOthing in charts give me that reason, unless you know something
I am saying this from looking at the indicators and knowing how the systematic hedge funds work, i can say with a rough ball park figure that most of them will be either closing their longs or shorting, as they all follow momentum. But im mainly saying this because of my indicator which is showing bearish levels of the last time we had a big dip all the way to 6300s
Like i said, i dont know what will happen on the 18th (im hoping a big jump)…the only thing tht will effect my indicator is a big fking jump, maybe 18th dec will provide that?
also guys, if u see a big jump…believe me that jump will go on for veryyyyyy long (unless something dramatic happens), if i do go long on 18th believe me my plan is not to take profits any time soon!
The reason im saying this is because i know most people will be taking profits at 6800s, thats a pullback point im thinking but believe me it will be going above that (not by end of year obv, dont know when)!
U can also see on daily charts that RSI has made enough space for it to move more lower…Targetting 6350s
hashmash, why you do not show us that indicator ? Why not share as I share my charts ? You just talk but nothing to backing up
ouch
lol why u losing ur temper PMS..
Am i not allowed to have my own views? or am i ONLY suppose to follow ur trades?
And the reason I cant show the indicator is because it took me ages to make and it wont work for u as u need bloomberg terminal to pull in data…
I mention the positioning of the indicator everyday so not like im keeping some secret behind..and its not a secret how that indicator works, just looks at the markets broadly and says this is the direction.
U can see im not posting much during the day as people here are losing their temper on bad trades they’ve made and not cut their losses and then taking it out on others lol.
If ur soo sure that 6440 is the bottom..buy it then?
Either u need to read all my posts properly or i need to write properly (probably latter lol), im not saying we gon see a financial crisis till 18th dec..im saying ftse will be in red till 18th (assuming no tapering), if tapering then considering how everything is laid out, we gon be seeing a drastic drop.
SOO thats why i say no taper, but till 18th we going to see ftse dropping, not madly..but there will be a drop.
Lol Why you say I’m loosing my temper ?
Far from that. I’m very confortable with my position as I do not use high leverages as most do in opposite trends. I could have closed that day with small gain, but I preferred to keep it and look for the bounce that it must come soon.
I really am looking for a huge bounce. Last friday I thought we started but that Taper thing, cut the momentum.
If I said something you did not liked it, I’m not the first. You always talk about that indicator, but no charts, no spreadsheets, nothing, lol.
In a forum I use, rarely these days, as they do not trade FTSE, you would be the joke with that secret indicator.
ANd RSI is lower than it was last week, even lower than Oct.9. Is at 29,18.
Looking at May bottom, it only stayed below that level (RSI 30) for 2 days.
SO you are targeting a major drop Monday, Tuesday and Wednesday, at least.
A lot of drops with no major events until 18th.
lol well lets see, this the thing about “INDICATORS”, 2 people can say different things about same indicator…
from my view, Daily RSI is showing a drop.
Lets see what happens on monday,tuesday,wed..aggregate change of that day will be ftse in negative..
And you have an inverted hammer at this bottom today
hashmash, now my view:
I think we will have a bounce Monday with Taper off expectations and then yes another sell off. I did not see any bounce today and the market needs a breadth from the drops.
PMS — FTSE is making a valiant effort to turn around. But will it make it?
The down channel in this graph dates from 30 October of course. 🙂
http://img545.imageshack.us/img545/263/dtiy.png
The confusion is that everyone is talking about a major correction if not this month certainly in the new year. So why does anyone really want to buy this up ?. The Mar. ftse future is indicating a price lower than 6400 I think.
The bird from IG Index is predicting a ftse 6000 ?? WTF ?
hashmash, I give you another almost 100% sure indicator and I share with you. It has 3 rules and focus in VIX.
But you need to use stops very tight, but if it works you have 50/100 points in SPX.
In VIX :
1st a close outside BB
2nd close inside BB
3 a daily candle close below previous day.
In the 4day or at the close in previous day, you put a stop above the highs of that day and you will have a good bounce or drop in SPX.
*below/above. If its a drop or a bounce
..that said I tend to agree with PMSTrader, there would normally be a small bounce as the market “breathes” but i don’t expect much above 6480/6500 tops. Then we can all look forward to selling the sh.t out of this !
We are with the same pattern as last week.
I think we will go a bit further maybe 6520/30. Write it in a paper.
…before or after Dec 18th ??
Before
No offence Pms even if we do get back to 6520.. does that prove anything to u?
I mean if u cant even follow momentum how can u predict pullbacks which is full of noise?
I dnt care about pullbacks as they jus an opportunity for me to add..
what i do care about is what people wud think is a pullback but infact is a reversal.
and yes maybe we will see ftse up on mon.. maybe we wont see ftse drop at all…but my view is different.. over next 3 days im expecting an overall drop n im allowed to have my own views 🙂
And the style of indicator u mentioned above..
please dont u think theres smart enough people running hedge funds who wudmt have already tried a monte carlo simulation on every predictor with shit loads of variations in parameter.
If ur predictor is soo great.. then y arent u on forbes.. or a multi millionaire.. y u trade everyday n not jus then?
What you mean, proving what ?
If you look at my last charts, and my prior posts, you would understand why I predict a throwback to 6500+. There is nothing special on it. Is common sense. But I’m suspect, because I already have a position.
You could argue about my exits but not failing to follow the momentum.
Rarely or I cannot remember the last time I did not follow the momentum right in the spot, with cash.
But what irritates me, in this forum, there is no one besides me, Jim who back up is thoughts with charts.
I really would like more people showing charts with ideas for discussion, not just what they feel about the market…
Everybody else just saids where it enter and exit and what is the sentiment and so on, but nothing to back up.
What is the point of that ? I like to see discuss, constructive criticize and so on but with charts.
Not secret indicators and so on. For me this is bullshit, is like the guy that saids he saw an UFO 😀
Well… I can say I already saw an UFO, but I can back it up with photo and video 😀
So I’m not full of bullshit as many I see here.
Agree 😉
At the moment primarily just scalping, quick short profits here and there, then when I have some ‘solid money’ under my belt again, will trade on more longer time frames and hence be more reliant on chart analysis.
If I was to post the charts for my 1-15 min scalp, the trade would be gone (LOL) so this method is sadly not amenable to the posting of charts immediately when the trade is live..just a quick heads up..few words…gone…like Twitter scalp earlier.,,also with this method you have to witness so much ‘noise’..the smaller time frames 1-15 minutes is so volatile, and very difficult to execute at times.
This strategy is not recommended unless you can concentrate for long periods of time and can learn to avoid the ‘pollution’.. i.e. ‘noise’..also known as ‘false signals’..
I think this will gap down on open Sunday night to get through 6435 barrier.
Hi, I’m new to the game, might sign up to Nicks service, right now I’m just playing around with about £1k, I have a £3 per point order for a long on 6550.
Rol…lol…that woman that you are alluding to on IG is no ‘bird’..she is a ‘moose’ 🙂 Which one are you talking about?? The real bird is Janet Yellen.. 🙂
Lool now reqding pms traders indicator qgain… sooo fukin retarded hahaha..
its like saying “hey people i fukin can bet my life on that monday we will either be up or down” well ficking duh…i guess even a retard can be rich if u cud bet like that if no premium existed.
Appologies for bad languae im drunk..lolol
vut honestly read pms indicator.
“rule 1 if thid happebs
Rule 2 if this halens
Rule 3 if this happens
if all happens the there will either be a bouncr or drop”
lmaooooooooo fukin hell go watch teletubbies or something
YOu are retard. No doubt on that. I’m not the first saying it.
But now you show me.
End of discussion. Nothing productive will come out of you. Stop posting your bullshit indicators and so on.
I even told when I became bear in FTSE long time ago, with real indicators, not ghost indicators. I posted here
Rational view is that FTSE is unlikely to rally substantially/or at all until Fed FOMC decision on Wed at 7pm our time.
In the meantime expect a small further drop to test next support level of 6350 or if no drop a simple HOLDING PATTERN until fed decision.
Until then FTSE will be just churning, like a mouse on a wheel, going nowhere really…but it’s only 3 days…Mon, Tues, Wed. Then Wed 7pm…’fireworks’
as algos kick in and do their bit whatever the shit that has been programmed by the likes if Goldnan Sachs…GL..
*of …Goldman Sachs
Well at least I can say I didn’t start this one… 🙂
Well look on the bright side..at least me and Sarj are friends again…who needs FTSE? 🙂
No worries Sarj, apology accepted..sorry if I was rude, and to you as well Raymond…sitting at my desk for long periods of time with no human interaction sometimes makes me mad…especially when I have not made any money or my trades turn out wrong…instead of a punchbag I turn to xxxxxxx… lol
I need to control my emotions more…If I was in court doing that judge would throw me out…lol..still I got till September to sort out my tantrums….I blame the bloody ‘taper tantrum’ doing my head in all year!! Bernanke you have a lot to answer for…
It’s such a shame this message board has been hijacked by a few unintelligent, semi literate, childish people.
Guys..guys..make peace… it’s difficult enough to trade FTSE without all the extra negative energy clouding your brains! 🙂
Just winding down listening to one of my favourites Barry White-Love’s theme then Grace Jones-La Vie En Rose-rockamerica remix. Try it…it will help you to relax.. 😉
Sorry, post should be at bottom not here, got Geoff above…hope he is not referring to me 😉
Fuk of geoff if u sayin that to me.
YOu said it all 😀 who complains assumes 😀
Markets worry about #Fischer. Not to worry. He believes in forward-guidance based on targets not time. Perfect. @federalreserve
Ghost indicator or real indicators dnt make a diff…. ur a loser for bein rude as i pointed the drop of ftse to 6350 6400 level wen it was at 6700..n u are ridiculous to say oh i pointed ftse to be bear market.. u flipped on me a couple posts above sayin y wud ftse fall… lool
go tweet some of ur ignorance.. maybe some unfortunate starter wud fsll for ur
“If market goes up down and up them most likely next bar will either be up or dow n” lool honestly the most hilarious thing ive heard.
ur prob like 30+ single sitting at home trading 2£ a point thinkin ur some big shot trader.
nothi g wrong wirh trading 2£ a point but dnt act cocky.
😀 you are really a child. When I exit in my trailing stop, I became bear in FTSE but the indicator only show me in NOV.7. But as I already posted many days ago, I do not trade the short side as a common rule. Only if I’m comfortable on doing that. Everyone knows that shorting is not the same as buying, concerning timing, etc.
In these cases I prefer being aside looking for long positions.
ANd FTSE is still bull in the long term, if you can figure that out :D, as you already lost money shorting heavily 😀
ABout that 2pp or any f*** s** you are saying, I already traded heavily with 50 pp, but not the smartest thing to do. Is not good for risk management.
I will not tell you how much points I trade, but what is important is the gains/losses, you f*** retard
Hey everyone i got a secret indicator..
similar to pms trading style.
I can say with 99% guarantee that monday we will be either up or down.
now go make money!
Sorry to pms for leakin out his secret indicator…looool
The tea-leaves are saying pretty much the same thing… could go either way… hmm 🙂 lol
PS no ‘flags’ (tea-leaves or otherwise 🙂 ) for Monday… anyway, if the FTSE suddenly does shoot to 7000+ it is cast-iron, concrete-encased guaranteed to catch us on the hop lol 🙂
Crazy Friday ( I want the iPad air from intertrader )
Nikkei 225 rolling daily 13/12/13 05:49:43 -X 15480
Nikkei 225 rolling daily 13/12/13 05:59:00 X 15430
Nasdaq (0.1) rolling daily 13/12/13 06:10:17 -X 3469.2
Nasdaq (0.1) rolling daily 13/12/13
07:36:00 X 3468.7
French CAC 40 rolling daily 13/12/13
07:37:18 X 4070.3
French CAC 40 rolling daily 13/12/13
08:36:36 -X 4079.8
Nasdaq (0.1) rolling daily 13/12/13
08:49:14 -X 3472.1
Nasdaq (0.1) rolling daily 13/12/13
09:13:55 X 3469.8
DAX 30 rolling daily 13/12/13
09:31:32 X 9029.7
DAX 30 rolling daily 13/12/13
11:33:40 -X 9040.0
French CAC 40 rolling daily 13/12/13
11:35:49 -X 4080.3
French CAC 40 rolling daily 13/12/13
13;39:29 X 4073.8
DAX 30 rolling daily 13/12/13
13:39:51 X 9011.5
DAX 30 rolling daily 13/12/13
13:55:95 -X 9012.7
DAX 30 rolling daily 13/12/13
14:00:08 X 9008.0
DAX 30 rolling daily 13/12/13
15:01:52 -X 9012.5
French CAC 40 rolling daily 13/12/13
15:11:09 X 4065.8
French CAC 40 rolling daily 13/12/13
15:42:20 -X 4065.3
Nasdaq (0.1) rolling daily 13/12/12
15:48:39 X 3463.0
Nasdaq (0.1) rolling daily 13/12/13
16:30:03 -X 3458.1
Nasdaq (0.1) rolling daily 13/12/13
16:30:14 X 3459.0
Nasdaq (0.1) rolling daily 13/12/13
17:17:07 -X 3461.2
Nasdaq (0.1) rolling daily 13/12/13
17:20:11 -X 3461.8
Nasdaq (0.1) rolling daily13/12/13
17:41:55 X 3460.3
Nasdaq (0.1) rolling daily 13/12/13
17:45:50 X 3459.8
Nasdaq (0.1) rolling daily 13/12/13
18:04:02 -X 3461.4
Nasdaq (0.1) rolling daily 13/12/13
18:04:23 -X 3462.4
Nasdaq (0.1) rolling daily 13/12/13
19:06:20 X 3455.3
Nasdaq (0.1) rolling daily 13/12/13
19:06:37 X 3454.8
Nasdaq (0.1) rolling daily 13/12/13
20:30:49 -X 3463.9
Nasdaq (0.1) rolling daily 13/12/13
20:30:59 -X 3463.9
Nasdaq (0.1) rolling daily 13/12/13
21:14:32 X 3457.6
Put X or -X instead of stakes as agreed no ££ only points
Usually no time for days like this but I wasn’t working on Friday, luckily made a few quid for Xmas. Will spend all on my family 🙂
Only two of those trades been closed with a loss….
Seems to obvious that 17th will provide the huge reversal where everyone will go long and profit… Nothing but a guess but I wouldn’t be surprised to see a fake break out, then a huge drop to wipe them stops at, then maybe the real reversal. It’s not ganna be so simple I don’t think.
You can bet your bottom Dola … 🙂 lol
You bet White
When it’s too obviuos it will not happen.
This is what I’m afraid. Lot of people beting on 18th. Something will happen before the actual news come out and after something in the opposite direction
I’ve noticed a ‘conjunction’ 🙂 between a ‘channel top’ 🙂 and a ‘line’ 🙂 at 6475 on the FTSE in what appears to be some bullish divergence between the line and the channel (line more bullish), although both channel and line still in downward trajectory… hmm 🙂
Anyway 6475 might be worth keeping an eye on on Monday… hmm 🙂
Forgot to add, the channel top and line ‘conjunct’ at a crossover point i.e the line passes from below the channel top to above the channel top (forming an ‘X’) … very interesting formation to say the least.. 🙂 … probably means absolutely nothing but a very interesting formation nonetheless… lol 🙂
The ‘channel top’ might be around about the top of Nick’s Raff channel… but will have to wait until Monday to find out… 🙂
And the channel top also touches the high on Monday 9th December at 6568.40 (EXACTLY)… hmm 🙂
And a line drawn from 6638.47 on 29/11/13 gives the intersection.
… passing through 6474.66.
giving a very symmetrical looking ‘X’… hmm 🙂
Can you put the chart ?
No, not really… 🙂 , just something I noticed (and also quite a round-ish number 🙂 ), but I would take it with a large pinch of salt (not to be taken seriously) 🙂 … it is just something to keep an eye on, you never know, maybe of some significance, then again maybe not 🙂 Its not as if the FTSE is obliged to play ball with some random ‘chart’- the FTSE can do whatever it wants….. as it no doubt will… 🙂
Wow, just calculated the pivots for Monday and resistance 2 is 6474.66 (which is EXACTLY) where this ‘conjunction’ is (hard to make out out to the exact decimal point). So we have resistance 2, this ‘channel’ top and this ‘line’ all intersecting at 6475. We would obviously be watching resistance 2, it just gives it a bit more weight and significance since it is not every day that you see this sort of ‘conjunction’. Sounds like astronomy as in Mars-Venus-Moon ‘conjunction’ lol
For Monday 16/12/13 on the FTSE
R3 – 6486.56
R2- 6474.66
R1- 6457.31
Pivot – 6445.41
R1- 6428.06
R2- 6416.16
R3- 6398.81
.. Can anyone here just explain in simple terms why the ftse should keep backing up whether it’s 100 or 300pts and don’t mention taper because it’s a red herring, the overall consensus is positive for 2014,
Question – If you knew 100% that the fed will not taper on the 18th Dec….. What would you do on Monday ?
.. Well I wouldn’t go short, that’s for sure but as somebody mentioned earlier the computers have ready been programmed for such an event and it will probably mean a microsecond low to high of 100pts so play an order to say open 75pts below the ftse number at 6.59pm 🙂
No tapering means buy buy…. And IMHO there will be no tapering in December would cause too much of a sell in financial markets.
cannot understand what you say. Are you saying no tapering can cause a major sell off ? The opposite of what is expected.
I’ve been taking a look at FTSE/monthly, searching for direction. My ϵ-channel is from Jan. 2010, and shows a decent rise over the period to present. From and including Feb., the candlesticks have been contained mostly in the upper track, although the ride has been choppy. Right now, at 6440, the index is positioned a whisker above the central trend line, having fallen steadily through last month and this. The indicator suggests the likelihood of further easing off the top over the next quarter. (The band shown is a function of the rate of change of the index. The thin line is the rate of change of the smoothed rate of change of the index. The latter is intended to give early warning of changes in direction, and succeeds now and again. 🙂 ) In this sort of scale and context, IG Brenda’s headline promise of 6000 is less hysterical than it seemed on impact!
I seem to have managed this without “effing and blinding”, which will be a relief to some. I know that I sometimes stray into sarcasm but this is no more than mischievous.
http://img43.imageshack.us/img43/5521/zadb.png
… Can’t see a drop like that during Dec-Feb, hasn’t happened since the 2008/9 crisis, 6650-6700 looks like a realistic year end figure even with tapering 🙂
Extrapolating from 01/01/2010 projects year end 31/12/2013 onto 6418 and extrapolating from 01/01/2013 projects year end 31/12/2013 onto 6714. Hmm….. 🙂
Trying the same thing for last year:
01/01/2010-13/12/2012 – 5787
01/01/2012-13/12/2012 -5769
FTSE actually closed on 31/12/2012 at 5897.80
so 5897.80-5787 = only 🙂 110.80 points out 🙂
and 5897.80-5769 = only 🙂 128.80 points out 🙂
show how accurate this sort of thing is – NOT! lol … 🙂
Some more extrapolating 🙂
Applying Nick’s constant 🙂
6418 +/- 110.80 = 6528.80/6307.2
6714 =/- 128.80 = 6842.80/6585.2
FTSE year end somewhere between 6307.2 and 6842.80? anyone want to bet? lol 🙂
or using 128.80 on both extremes:
6842.80 to 6289.2 hmm 🙂
only a 553.6 point range 🙂
Hi Jim, thanks for another viiew of the FTSE.
But in my opinion there are two things you did not mention:
1st- we still did not reach the end of the month, so that candle and indicator could change.
2nd- All the markets are interconnected, so this prediction need to count with the others also. If you predict a bearish for the FTSE next quarter, this will reflect in the others
Seeing a lot of 6350 or lower expectations here giving me hope for my long. It feels like yesterday that ftse was 6810 and people were talking 7500. Whether there is a taper or not (appreciate an immediate impact) equities remains the place to be for cash. Just got to take a long term view. These will look like small pull backs on the yearly chart.
Hi PMS and Hubris – Thanks for your comments. Good points PMS, and readily accepted. Hubris, my post above is intended to be exploratory – I’m no more than open to the possibility of a bearish first quarter, within the probable constraints of the monthly ϵ-channel shown. I suppose that the use of channels is a matter of individual preference. It seems to me that they depend for their validity on the idea that boundaries which have largely contained a series over a given period are likely to continue to do so when extended over a reasonable period ahead. On the other hand, if the series breaks out of a previously valid channel, that marks a change in direction or behaviour.
The list below shows name of index, followed by absolute percentage growth from 1 January 2010 to 13 December 2013, and finally the annualised percentage growth figure.
S&P 500 58.9% 10.2%
Dow 51.0% 8.8%
FTSE 19.0% 3.3%
DAX 50.7% 8.8%
The FTSE’s growth performance has been markedly inferior to that of the other three indices, which is reflected in the gradients of their respective ϵ-channels. The US indices, for example, might be expected to visit their lower boundaries in the course of time, without necessarily disrupting their current gradients. I am concerned though that in this event the FTSE, hampered by low historical growth, will suffer a relatively severe correction. This is a worry rather than a prediction. 🙂
i beleive ftse will have a good rise this week…….based on preformance of eur usd which took a good drop down after close on friday…..last friday close took a bounce up after close and came back down at open on sunday eve …….unfort i was short to earley so had to sell of half my trades. each time ftse rose last week eur usd came down and vice versa ….iexpect eur usd to rise at open to night coming down to where it came down to at close fri in next few days only my veiws but might be worth a short ………… GL
for anyone who cares, i will be keeping bearish position, until i see a bounce on 18th (if it even happens), will keep updated.
If i close/change my position will update here (usually within a minute or so)
Interesting 😉 Just logged on..Dow futures down some 90..FTSE 40 pts at 4 am..glad I went ‘flat on Friday ;-)..back to bed for a few hrs..
Hate an out of hours stop out…
long 6440 stop 6390 target 6650
Very noticeable strength in market breadth to the upside, so suspect short term low in overnight. However, my last 2 trades being stopped out so don’t follow me anyone !!!
good bit of speculative luck this morning put in an order friday evening on dax at a very specualtive 8970 long pos got picked up this morning around 4 am just come in office this morning to take a very healthy 150 pip profit totally unexpected rate of ascent , i have just booked it looking to come back in later this week hopefully somehwere around 9040 to go long again and then ride the lift hopefully with a 40 point stop loss back to 9000 , i remain in the view that this will dip back from here beofre news later this week , im hoping for somehwere between 9250 and 9350 before xmas shut down being cautious of any pullback under 9000
i aint trading the fed taper so will be out market till thursday. from experience good chance of losing big on these announcements. sticking to my trading plan which states dont trade on major announcements! i prefer a slow and steady growth in my account.Also beacuse unless your using guaranteed stops could lose big.