
Support 6000 5960 5947 5910 5898
Resistance 6006 6018 6026 6048 6130
Good morning.
Market Summary for Monday 22nd February
The FT100 looked initially like having a negative open as the overnight IG price fell below 5900 only to rise significantly after positive commodity price movements and Far East trading.
The good news outweighed the bad news of the UK referendum which had unsettled markets as it appears it will be far tighter than predicted.
The UK Pound fell by around 2% at one point which helped internationals but domestic companies suffered. A weaker pound also put pressure on property shares as it would indicate an upward chance of interest rises and also foreign investors don’t want to invest in property in a country which may exit.
All this resulted in commodities being the strongest sector and property the weakest.
The overall trend was quite positive moving up steadily for most of the day closing at 6037
US & Asia Overnight from Bloomberg
A global equity rally stumbled as most Asian gauges slipped, while U.S. index futures dropped. Crude slumped, the yuan weakened and the yen climbed.
Benchmark equity indexes in Japan, China and South Korea turned lower, while contracts on the Standard & Poor’s 500 Index slid 0.4 percent. Japan’s currency appreciated against all 16 major peers and Treasuries rallied. The yuan declined after the People’s Bank of China lowered its daily reference rate by the most in six weeks. New York oil dropped after surging above $33 a barrel on Monday, while nickel and zinc led industrial metals lower.
The first indicators for Asia’s biggest economy this month showed private gauges of manufacturing and services falling to new lows, while a reading of business confidence slipped. The impact of China’s slowdown and the commodity-price collapse was in focus Tuesday as BHP Billiton Ltd. made a larger-than-expected cut to its dividend, lowering the payout for the first time in 15 years, while Noble Group Ltd. blamed the tumble in coal prices for an additional $1.2 billion in charges.
“If there’s something dramatic in the Chinese market, then normally people buy U.S. Treasuries,” said Toshifumi Sugimoto, chief investment officer at Capital Asset Management in Tokyo. “The Chinese economy is not doing well.”
Stocks
The MSCI Asia Pacific Index dropped 0.1 percent at 1:02 p.m. in Hong Kong, falling from its highest level since Feb. 8. The Shanghai Composite Index retreated 1.3 percent. The Topix index lost 0.3 percent in Tokyo, while Australia’s S&P/ASX 200 Index slid 0.6 percent. The Kospi index declined 0.3 percent in Seoul.
BHP added 2.7 percent in Sydney, paring its 12-month drop to 41 percent. Underlying profit fell to $412 million at its continuing operations in the six months to Dec. 31, from $4.9 billion a year earlier, the world’s biggest mining company said Tuesday in a statement. Noble Group was little changed in Singapore after saying the impairments will force the embattled commodities trader to post its first full-year loss in almost two decades.
Bonds
Treasuries rallied, pushing the yield on the 10-year benchmark note down three basis points to 1.72 percent. Rates on similar-maturity Australian bonds slid four basis points to 2.42 percent.
Currencies
The yuan fell 0.09 percent to 6.5284 a dollar, according to China Foreign Exchange Trade System prices. The People’s Bank of China lowered the daily reference rate for the yuan by 0.17 percent, the most in six weeks. The fix was lower than most models were expecting, said Sue Trinh, the head of Asia foreign-exchange strategy at Royal Bank of Canada.
“It seems to be a direct policy signal to weaken the yuan, at least for today, and that is seeing dollar-yen leading the way lower and cross-yen selling off as well,” Hong Kong-based Trinh said. “If today’s fix is the start of a trend, then it would be consistent with our view that China needs a more flexible exchange rate and, in other words, a weaker exchange rate.”
The yen gained 0.5 percent to 112.34 per dollar, rallying from a decline Monday. Options traders are close to the most bullish on the yen since 2011, pricing on six-month contracts show.
Commodities
Oil traded near $33 a barrel as the International Energy Agency said a global surplus will persist into next year and limit any chance of a short-term price rebound. April futures in New York slid as much as 1.7 percent after the March contract expired Monday up 6.2 percent. While supply and demand will be aligned next year, large accumulated stockpiles will slow the pace of recovery in prices, the IEA said in its medium-term report.
Nickel retreated from the highest close this year, with the metal used in stainless steel falling 1.3 percent to $8,660 a metric ton. Copper dropped 1.3 percent and zinc declined 1.2 percent. [Bloomberg]
FTSE 100 Outlook and Prediction
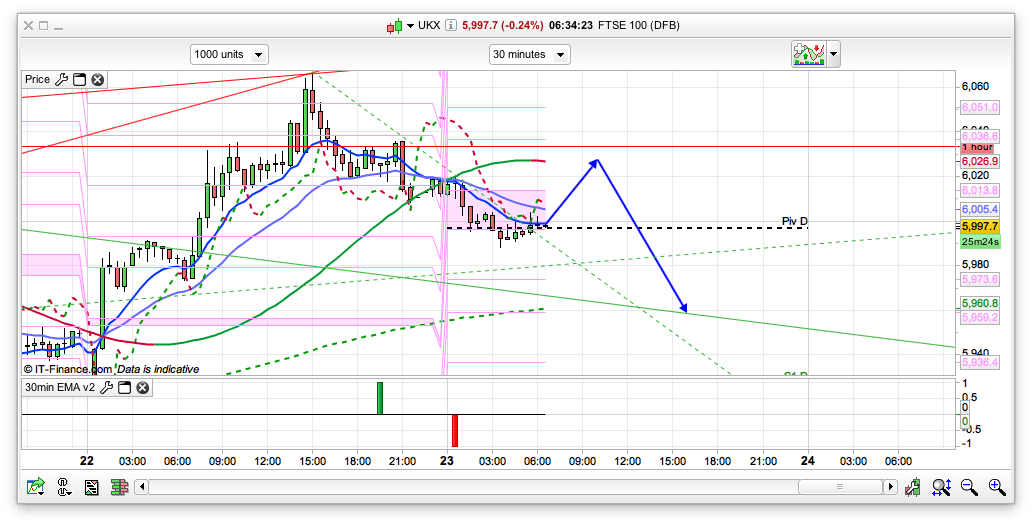
We moved a little bit higher than the 6045 resistance area I had for yesterday but the bears managed to fight back and we have dropped off again overnight, and also are just sticking the nose below 6000 as I write this. The 2 hour chart is still bearish, whilst the daily is just crossing to bull, with support at 5898, and as I mentioned yesterday I do think we will get a pull back after the rise from 5500 before we push too much higher – we rose a bit too far too fast in the past 10 days, and on nothing really. For today the 30min has gone bearish with resistance at 6006 and then 6026 just above that – a level that I feel would be a good entry for a short for a dip to the 200ema on the 30min at 5960. There is a chance that we will dip further however, I think that would be decent support if seen today as we have some PRT supports here also. Psychologically, 5950 is likely to be a decent level for the bulls to have a go at 6000 from also, as well as the 10 day Bianca at 5947. That said, if it breaks then 5898 is pretty likely. So, for today, weak bull to start with but favouring a bit of a pull back, ideally from 6025.
Morning all,Went short the Dax and it ate my Phone Bill,must be Tuesday.
Morning WSF
Short 5994 – Moved Stops to B/E – Stopped at B/e
Short again of pivot 6017 @ 6014.98 – Maybe too Tight(er) Stop 6021.4.
Mixed signals at the moment & divergences making for a cuffudled picture
Thanks for posting those Charts last night.
Morning.
Rallying off a test of 5980 quite well at the mo, uptrend still well in place, higher lows and higher highs, all good for the bulls.
Very much buy the dips a popular fomo approach at the moment, but with slight loss of momentum possibly showing with a divergence on cash rsi, when/if those BTD’s stop immediately turning + then the lows would be more likely to be tested than the highs. I think that will be this week’s theme, but then I would.
5980, 5950 and 5916 are support as I see it, with minor resistance around 6020/30 and then prev high at 66.
DAX seems stuck 9300/9600 and slightly more bearish than the FTSE.
The much touted DOW double bottom is technically confirmed if 16500 holds, and the theoretical target is the moon.
I actually longed (gasp) the 80 support this morning, came out too early and just now short at 20, 12 either way.
Funnily enough I longed the ’80 too, then sold it at ’10. Chipping away! I would say this but it still feels very squeezy – knock it in the morning and grind it back up. Going to follow Nick, if it gets to ’25 will add to short (the one I should have done at ’50 yesterday!).
Nice one chippy.
That’s what I mean, when even bears like us are buying dips it’s a self fulfilling prophecy, but next time (if) it gets to 980 then that’ll be a lower high and, all of a sudden, longs will be thinking Hmm this doesn’t look as cheap as it did last time, maybe I’ll wait till 50 and, bang, change of sentiment.
Bear pep talk over.
🙂
Sentiment is the critical word!
Nice clear 1 min uptrend on the DAX currently being tested on the DAX at 517, we’ve already broken ours, maybe in for a bit of sideways stuff for a while.
Stop to 25.
Broken while I’m typing, 9500/6008 need to hold.
Just a micro signal for anyone who’s following 1 min rsi.
As you would expect in a steady rise like this, 40 has held three times since the lows, but now under test for the fourth time after making a 60 high. If we break 40 then fail again at 60 that could be a change of trend sign for me. or not.
took +17 anyway in my time honoured too early fashion.
Sell the bounce at 10?
Looks like there’s one of those ZigZag Gaps at 6005 (8:49)- filled.
///Puh ! That should have been my trade…FTSE 6002
lol ZZ would be having a field day recently, more gaps than the Underground…
What is the remotest logic basis for gap filling I wonder?
Something to do with momentum from areas of strong demand or Supply which is exhausted eventually would be my guess,probably made more sense when individual players with their set prices dominated mkt’s.Isnt there a decent and unfilled Dow gap from the Great Depression?
Sorry,meant the demand or supply gets exhausted.
Tempted (L) here – but thinking it would be better at < 5994 area on the basis the MACD would give ma better set up.
I longed it for +3 lol pure 1 min <15
Sometimes I’m not sure if we should be chasing 3 – 5 – 8 point moves (binary stuff) or larger moves…
two answers to that
a) don’t “chase” anything
b) blue ink is blue ink
Yes tmfp – maybe “chase” was a wrong choice or words – blue ink – too tighter stops spring to mind !
Wonder if the ATR holds a clue e.g 3 x ATR on what ever time frame your using – on the 1 min at the moment it’s 2.26 – so move of 6 points would be target.
Just a thought.
980-021-95=61.8%, good bounce, setting up that 6010/60rsi short or a continuation to the highs?
Looks like the former, missed it by un point 🙁
Test of lows coming, I reckon, maybe a bounce to 6000 first.
LOL – I was just about to say that the move to 6021 was a 50% retracement of yesterday’s Hi 6065 and this morning’s Lo 5977 – but what the fuch – there are so many clusters of support levels from 5970 – you could apply it to any of them…
Sure fib is everywhere, just saying intraday that 010 coincided with a revisit to previous support and rsi resistance. Allow 10.06/10.07 candles as exhaustion reversal and it was text book.
Hello again. I know you guys are not so interested in my longer time frame, but patterns are patterns?
If so, have I just noticed a bear flag on the daily Dow, from the 17750 high? Rough projection, 14250?
Hi Cowboy – What time frame ?
One for the pot maybe …
Cowboy – I was reading your post again last night and thinking of something constructive for you. If your investing in your SIPP and ISA stuff…google Nutmeg for starters . Then think funds rather than individual co.s – to much of headache.
It is a balancing act to be honest ..but you could retain your 3UK shorts as protection……
Hi Cowboy,I wouldnt say not interested,sorry if you got that impression,just depends on what else is going on,are you talking about 30th Dec high?
The run up from 15900 or so ????
I cant see your target with that high,because there were higher highs before it,so I’m probably not seeing something obvious or you meant a different Number ? Dow weekly is a Bearish chart if you want one,although with about 1800 points of decision space in it.
hi WSF,
Yes, the 30 dec high. There were higher highs before as you say. Perhaps I’m not measuring it right – still learning…
Steep decline in early Jan to the low on 20th Jan is c. 2250, then a gently upward sloping flag channel. Basically only a tail up through the line yesterday, closing below it. Project 2250 down from here – 14250ish.
🙂 Got you,thanks,on Weekly from Sept to Nov/Dec,so then,from me, pure hindsight/text book,that trade is very nice and 15767 was the 200 sma which it hit ,putting aside the target,there is a difference between the day and week and on that weekly it looks like you can be right and it can go higher before turning fwiw.Definitely need some other indicators here to,too much space for R/R calcs and a decent S/L on the stuff I look at and nothing as a real target except that same 200 sma.I just tried playing with Fib on it and got 16700 odd as the lowest turn there if it climbs further.I checked Bulkowski for you and he says if it confirms as a Flag in a downtrend it is very high probability,about 88%,but I think his research is based on individual companies not manipulated by Central bank situations.I’m really cautious about this stuff and especially this timescale.I can see why this could turn down ,right now,using your flag and a trendline,but it wouldnt be an entry without confirmation and that trendline off the daily is a bit more area than line,lot of room to adjust it.The 14800 area is 2013 support.Thanks for pointing that out.
Me and chippy like the sound of that Cowboy, tell us more…
Hi Cowboy
I’d be careful holding onto short leveraged ETFs for too long. The below article explains:
http://monevator.com/short-etf-maths/
Hi Dan – Thanks for posting that link – interesting – I went on one of the other links http://monevator.com/low-cost-index-trackers/
That’s pretty much how Nutmeg makes up a portfolio. The advantage of using a Nutmeg is that you get a decent mix of all of them (& you can choose within reason) – if you bought the same it’s possible that you’d do quite alot on commissions to achieve a decent “mix”.
Yahoo Finance do a pretty good job providing a tracking portfolio as well of all the GB00B4M0****** numbers as well…. by the way….
Hey Hugh, nutmeg?! what do you mean?
Talking of nutmeg, this one is worth a look too http://www.fiveraday.co.uk
This is nutmeg Dan http://www.nutmeg.com
Thanks Nick
Thanks guys, interesting stuff. Are you a client Hugh?
Hi Dan – Yes – have been for couple of years…
I like it –
It’s very clear & like the fact that I can see the allocation.
I’ve put a screen shot of the allocation so you can get an idea of how it works etc.
http://i.imgur.com/JYP8Emc.png
The Name describes the allocation and the price paid of the allocation.
In brief – you define your risk tolerence from 1 (Low Risk – 10 (Most High risk) – then you allocate your funds accordingly e.g £1K in No 2 (Low) – 1 in No 5 (medium) – £1 K in 8 (moderate to high risk) then they will allocate the selected instruments that would be applicable. Very easy & neat to be honest.
Looks really interesting. I haven’t got the cash until this time next year – buying a new house. But i’ll probably set up an account next year. Are you showing a decent profit?
I’m looking looking but I don’t see any short, yet. All slow.
TBH Jack I’m starting to think this will be one of those days where its a close just above the open and below the day befores close,then another couple of days like it and then another big day,in sync with that recent Dow daily pattern but with less movement on the inbetween days 🙂
Yes, it feels exactly like this. Is there any news on Wed or Thurs? Quite a bullish 1 hour. But really flat today.
U.S Unemployment Thurs,G20 meetings from Fri.cant see anything scheduled,China,Japan,or rumours about Draghi,he’s next month ,10th might happen.
Thanks, hope they’ll shake things up a bit.
Sorry this is a bit late, small extra short at 10 as it has had umpteen goes at it. Hoping it’ll get below 90, looking for 60. Bit of a top scalp if it comes off.
Well this 12 point range is fun but all good things must come to an end I suppose and finally its looking like a test of the lows before DOW time, if that little failed bounce to 05 is any indicator
I didn’t mention the early resistance as, once again, talking my own position! Anyway, looks like we’ve got cowboy on our side, 14250 on the Dow would get ftse well towards your 5200!
Beautiful day today so am outside, don’t expect full commentary suffice to say that I’ll never hold the 10 short til 60 and will probably bottle it at 80, I have put a stop in at 6020 now.
Nope, wishful thinking, just reduced the range even further.
Looking ahead to the DOW, I’d have said that yesterday’s session was a bit disappointing what with the famous double bottom formed and all, so they’d really want to be kicking on sometime pretty soon, certainly not dipping below 16500 for any period of time.
I’ve taken a long position at 6000, with a 20 point stop, target 6155
I think the Yanks will come out selling till 16400 then back to 16500 by close
Hope so on the first part, but not the second bit. 🙂 I’m still short from 16040, yawn.
Si, hold in there. Like tmfp I’m convinced there is a big fall on the way around very soon. 5700 on FTSE which should be sufficient to make you a nice profit on your Dow trade. Good luck buddy.
Gold on the move upwards again
Yeah, gold’s been a strange market recently, still long term bear.
If you want an equities/currency alternative, have a look at Bitcoin. On a bit of a bull run at the mo, but worth buying on a dip I reckon.
Will be shorting gold after the next indices pull back. Sub $1100 by year end. Will aim to start entering around $1240
6025…………..
As a target for your long 🙂
I had 6027 as resistance so went for 6025. High was 6025.1 which was rather exact!
not liking >20 today is it? Or <90 either….
Good call Nick – I was doing the school run !
But managed to square up at 5986.
Woah almost got closed out
Yeah, up to you where you put your stop, but 80 has been good support today
Mad Half Hour coming up, hasn’t really been living up to its name recently, coinciding with another look at 16500 on the DOW, might shake a few out and test our lows
or of course we could have one of those convenient miraculous 4 o’clock rallies
Well that went well, not! Got stopped at ’20 then straight down to 90. Never mind, 10 more points to take off the average. Looks like my friend tmfp and I will be paying another dividend on Thursday.
If it carries on like this, I won’t mind that too much 🙂
ps Wednesday
Errr, no, not particularly fussed (big ish grin!) and Wednesday or Thursday, don’t think I’ll be that fussed there either!
Looks like the option traders have s@£* themselves, VIX up nearly a point or 4.5%. Also, looking around it seems the UK clearing banks held up quite well for most of the morning but have had a fair bit smashed off them this afternoon. I’d like to see ’50 go properly to make me really confident.
lol, don’t start cracking open the bubbly just yet, we’re only 100 off the high.
A close on DOW under 16500 would be nice for a start, then a bit more Asian weakness and all of a sudden, the balls rolling….the 5800’s are one session away, that’ll put the wind up a few if/when we get there.
(This is Bear Club talk, you others are only allowed to read it if you know the secret password).
Spooky, I was just about to give you the same “cracking open the bubbly early” talking to when I read the Emperor has no clothes comment! However, when all is said and done, it is nice seeing the blue numbers creeping up from the bottom of the telly.
About half of yesterdays climb and that r area from Friday on Dow,looks like Bears and Bulls are equally fearful at the moment.
US consumer confidence missed estimates and oil is 4% down. Suddenly looks a bit bearish.
Hooray!
No sudden about it.
The global economy is missing targets everywhere, the oil ‘consensus’ is only words and that’s all the Central Banks have left, words.
The Emperor has no Clothes.
Is that a pennant/wedge thingy forming on my daily Brent chart? Must be close to breakout, bias presumably to the downside. Less urgent looking in WTI, with a lower trendline to aim for first.
Obviousely, short I missed. I had a follower short with just +10 profit which is ok. I was a bit nervous about this short 434dax because I couldn’t watch it due to business elsewhere, it was closed on limit which I thought should be achieved while I could not watch, but SL was higher: 450 So it’s not the best trade in relation to r/r
I missed RJ lately. I wonder where he is… Must be busy like me.
Re: the earlier thing about gaps and their significance, I just popped into ZeroHedge for my daily end of the world fix, and they have this from BofAML’s Stephen Suttmeier…
“Mind the S&P 500 gap; below would suggest exhaustion.
The S&P 500 has gapped up three times in the last five sessions. Continue to mind the upside price gaps, as they are nearby supports. Yesterday’s gap offers initial support at 1924-1918 and it would take a break below this gap to suggest upside exhaustion. The next gap supports come in at 1899-1895, which held on Friday, and 1871-1864.”
So if 1918 breaks, then next gap support 1899. Basically, if today’s 16.30 lows don’t hold there’s a 150 point DOW hole, which roughly equates to ftse recent cash low of 5916.
Please let me know if you’re getting fed up with this continual bear propaganda….
I won’t stop, just interested. 🙂
No keep it up tmfp. You have got me convinced. Have been adding to my FTSE short again today. Now at £28 a point averages at 6024
So no artificial Dow rally tonight. Just grind down and trigger an Asian fall overnight. Then tomorrow we shall see where we are.
That would be good, yes.
Quite an important DOW close, this one.
If they pull a last hour 200 pointer out of their collective a*se I may well write a letter to my MP.
Also, the famous double bottom on US indices, doesn’t quite reach to the moon
http://i.imgur.com/oAFiSOY.jpg
As highlighted in the above, a decisive move above 1950 would put in a double bottom off the 1812-1810 lows and favor a continued rally. The first resistance is 1990-2025 with the falling 100 and 200-day MAs near 2000 and 2029, respectively.
The double bottom would count up to 2085, which falls well shy of the 2135 high from last May.
The double bottom from October projected to 2175, but the S&P 500 stalled well below that upside count, which was a bearish sign.
The risk is that a double bottom breakout above 1950 could set up another lower high within the downtrend from last May and suggest another rally to sell.
Well I dont think it’s done anything today,middle of the range fear equal for Bulls and Bears imo,support at an R area from Jan and last Fri and retraced half of yesterdays climb.I wish it would move somewhere,but I dont see better than 1:1 in any time frame or direction for an entry at the moment.
🙂 🙂 like a bus, moved when I said that.
The only fly in the bear ointment is the almost certain DOW run to try and close it above any crucial figure. I’m as big a bear at the moment as anyone (maybe excluding si), but am just watching Dow and playing my new rsi game, mainly on the long side. That said, very small and trying to nick 10-15 points.
Another fly could be that the real Economy and mkts arent the same thing and the fat half of the planet is willing to do anything to the other half to keep mkts up and generally does sooner or later.
Very true WSF, but the fat half’s grip has been weakening along with their economies. I doubt that China has ever had more global influence.
But yeah, trading indexes as a world economy surrogate is a bad idea.
Also true chippy, but it’s the law of diminishing returns. Closing runups with no follow through are a waste of money. G-d knows how low things would be without the threat/promise of plunge support, but sure, it’s a fact of life bears have to deal with.
And while we’re having a Teddy Bears Picnic, get your teeth into this from Tom DeMark:
“A top in the S&P 500 would be confirmed should the S&P 500 finish below 1,926.82 on Tuesday, or close less than 1,917 on Wednesday or Thursday.
If those S&P 500 triggers occur, S&P will decline at least 8.2 percent from Monday’s close to 1,786 (last February 2014).
Should the market top correspond with what he referred to as “bad news,” the S&P 500 could see deeper selling down to 1,736, an 11 percent decline.
He sees the current market rally as temporary relief as investors exit short positions.
“We’ve seen some pretty vicious short-covering come in, which has caused the market to move up,” said DeMark. “When that happens, it really plays havoc with the market once the downside move begins.
The foundation of this ongoing rally is suspect. The temporary buying produces a vacuum beneath the market which accelerates the subsequent decline. The decline is going to be sharp.”
Nice one, thanks tmpf.
Tmfp, you are out and out bear.
For the time being yeah, I think this recent rise is unsustainable.
Medium term, next couple of months, I think the jury’s still out.
A Bulgarian guy Krasi, who I respect very much for complex tech analysis, is pretty bullish after a visit down to around 5830, 1880 S&P.
http://practicaltechnicalanalysis.blogspot.co.uk/
A good close that though tonight, depending on Asia puts us around 950 support, so another important session coming up.
Goodnight.
tmfp
I just dont see yesterday confirmed as the top of this 10 day rally yet,or this year as fitting a collapse cycle pattern.I thought it would be down until mid march or so,but that stuff is inexact.Where would today be if Oil was up 4% instead of down?More than 250 points from yesterdays high? What would the claims about Oil be if it’s chart was the Dow? and Oil is in chronic over supply.Equally about 60% of current Bear arguments sound like Hope and could just as easily be Bull arguments,eg Free money from China,instead of terrible mkt collapse,if it turns down it turns down,but we’re still a bit above the average dead cat bounce height and I think the last 4 hours have just shown indecision and it’s dangerous to side with a majority view from analysts whose downside is issuing a revision to their opinions or people with an R/R startegy you wouldnt use yourself.
Hi WSF
My short position was taken on what I thought, and still do, was good r/r based on the down trend and channel continuing from a top that’s taken three years forming.
Yesterday had low volume and so far leaves this weekly candle with a 100pt+ long tail touching the 9 month old weekly downtrend.
Nothing is confirmed or certain until it happens and, for sure, I’d like a daily close under 900 to confirm a lower low to go with the lower high.
A realistic chance of that tomorrow, after tonight’s DOW.
That would then put pressure on Thursday and Friday to rescue a week (and month end) considerably down from a very bullish start.
Not sure where you’re going with the oil comparison, but if oil/equities move together, then one’s view of oil price movement has to marry with that for equities and for me, technically and fundamentally, I see both as bearish.
I’m only having a bit of fun with the rabid bear quotes from ZeroHedge, I remember recently Nick saying he’d been reading bullish analysis looking for new ATHs, this is just the flip side of the coin.
Incidentally, the guy I mentioned above, Krasi, makes a very good technical case for the bulls, after a short term pullback.
Hi tmfp,I didnt mean to knock your trade or it’s motivation I just think that most of the arguments for the last week have been like the ones from the Oil bulls and that the Bear contrarian trade has become a mainstream position recently and things are being ignored.Anytime a mkt is moving one way and people are saying that anyone trading in that direction is an idiot,like last week, then I have to question the reasoning ( 🙂 be contrarian) .The weekly chart is terrible,but above a rising 200sma and with an RSI that seems to be turning up and a price above the midline on Bollinger bands that are turning up.The day chart is up and hasnt yet turned down by Bollinger or all kinds of EMA’s and Sma’s,although the only major one it is above is the 50 (in the cash mkt) and that is still pointing down.There is a pattern on the day chart that says up and isnt yet broken We are still above a rising Trend line on the day chart,theres a weekly cycle suggesting this is an up week and so on,all just indicators and frankly I’m not against the idea of it going down,but I’m pretty sure that if anstel was here and if he was Bullish he would say that the first person to walk out of the G20 and point his snout at a microphone is going to be trying to lift this mkt.When I said R/R of 1:1 I meant today when it was mid 400’s,which was only about 100 points below where it was before the open,so I was looking at 350 to mid 500’s maybe higher as not showing much.From a Bear point of view I think it could go over 17000 without invalidating your argument,although youd have some momentum against you it’d still be below 61.8 (which is by the 200sma at 17042) and I think 50% of the last fall is at about 16790.I think the jury is still out and this isnt an area for an S/L on a long or short trade,but I dont see why it would turn here,this week.Mind you if we were talking about Australia I’d be saying I have no idea why it ever goes up nowadays 🙂
Sorry didn’t come back to you last night WSF, knackered 🙁
I suppose the basic difference of opinion here is that I don’t see a bear position as contrarian.
The +400 -600 pattern so far this year is the orthodox trade, jumping on a trend of 400 pt maturity has ended in tears either way medium term, and I’m hoping that will continue.
Just had a nice start to the day with the “revisit to the previous days close after a weak night” gambit.
GL
🙂
DOW coming down to close near the lows, good sign!
So, what’s your current position
Awful. Short £80, Avg 16145. 22.7k down currently. On the positive side, I made about 20k today – as in, I went from a 46k odd loss to 22.7!