
Good morning. Played out almost exactly as planned yesterday with the rise and dip, though the market must have read my trade plan as it missed the 2 automated orders (short at 6995 and long at 6915) by 4 points on both! Sods law. Anyway, having dropped off from the 6993 area where we had the 25ema on the daily it looks like we are in for a little bit of a dip still, maybe down to 6815. US retail sales figures yesterday came in flat, and the divi brought out a few buyers but not much. Been fairly flat overnight with the FTSE holding around 6930. The daily chart still looks a little bearish, though the bulls will be keen to defend any drop to 6893.
US & Asia Overnight from Bloomberg
Asian stocks declined after weaker-than-forecast U.S. retail sales fueled concern about growth in the world’s largest economy, strengthening the yen and sending Japanese shares lower.
The MSCI Asia Pacific Index fell 0.1 percent to 152.45 as of 9:06 a.m. in Tokyo. Sales at U.S. retailers were little changed in April compared with expectations for a 0.2 percent gain in a Bloomberg survey of economists. The Standard & Poor’s 500 Index slid less than 0.1 percent Wednesday for a third day of losses.
“While U.S. growth is rebounding, it may not rebound as far and as fast as many investors had expected,” Russ Koesterich, global chief investment strategist at New York-based BlackRock Inc., the world’s biggest asset manager, said on Bloomberg TV. “The Fed is likely to raise rates this fall.”
The yen gained 0.6 percent against the dollar Wednesday after the sales report. JPMorgan Chase & Co. lowered its forecast for second-quarter U.S. economic growth to 2 percent from 2.5 percent, with economist Michael Feroli citing a “failure of consumer spending to get out of the gates with any vigor in April.”
U.S. economic indicators have missed expectations since January, according to an index by Citigroup Inc. that measures data surprises relative to market expectations, suggesting the Federal Reserve isn’t getting any closer to raising rates.
Japan’s Topix index slipped 0.2 percent. South Korea’s Kospi index lost 0.1 percent. Australia’s S&P/ASX 200 Index slid 0.6 percent. Markets in China and Hong Kong have yet to open.
China Shares
China’s Shanghai Composite Index slipped 0.6 percent on Wednesday, halting the benchmark index’s biggest three-day rally since January, as energy and financial companies slumped after fixed-asset investment slowed to the weakest pace in more than 14 years in April and industrial output rose less than expected.
New Zealand’s NZX 50 Index dropped 0.2 percent. Reports showed the nation’s manufacturing growth slowed for a second month in April, while retail sales expanded 2.7 percent in the first quarter, beating economist estimates.
E-mini futures on the S&P 500 gained 0.1 percent today. [Ref]
FTSE Outlook
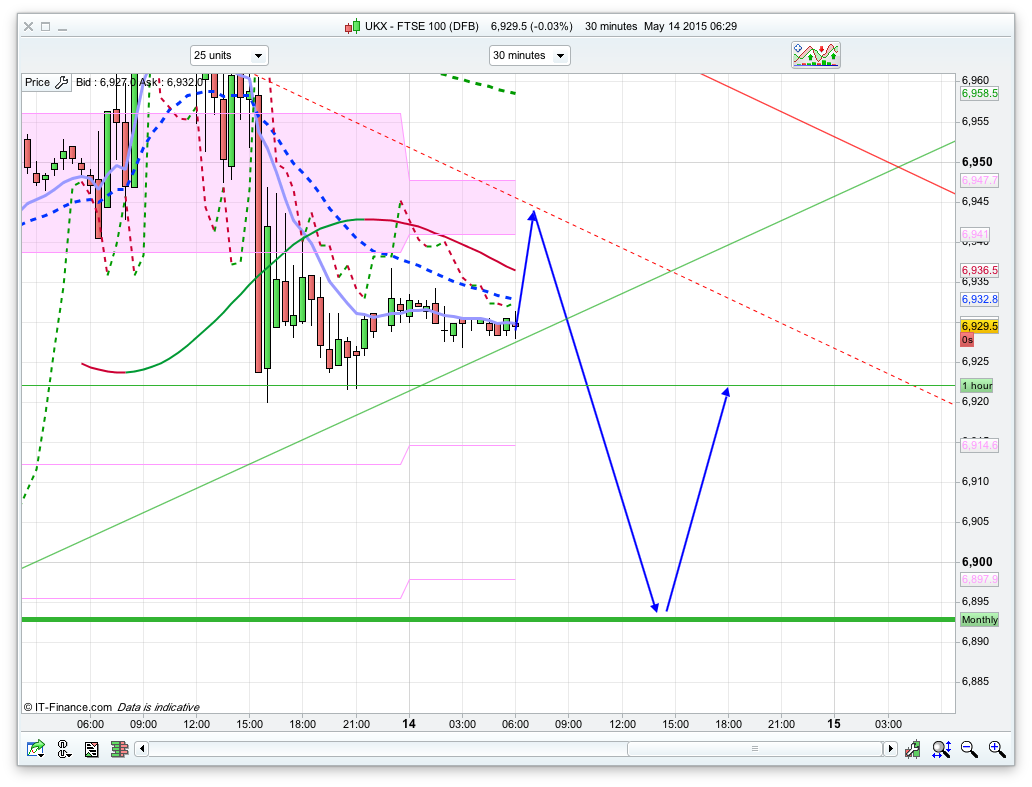
Todays pivot is 6948 and we also have a PRT resistance line near there; as such I think any rise might falter a bit here. The trend not he daily chart is down at the moment, but the bears won’t be fully in control until 6893 break as there is some decent support there. Below that the the bottom for he 2 Bianca channels at 6880 and 6845 are likely to be seen, certainly while the daily EMAs are negative thats a distinct possibility. As we have stayed fairly flat overnight we may get a little part up at the open or just before but it looks a bit 50/50. I think trying a short off the pivot and a long off the 6893 areas looks the best plays today, but the bulls will be keen to get that 30min chart bullish again as its looking a bit bearish at the moment. Resistance above the pivot is 6988 for the 25ema on the daily, with the top of the Bianca channels above that at 7034 and 7062. The Raff channels not he daily are pretty wide at the moment after last weeks volatility, so unlikely to touch those levels (7150 top and 6780 bottom) today. To start things off and why I think we may get an initial rise, the 10min chart looks to be trying for a bounce.