
4th December 2018
Turned into quite the decent drop off the 7135 level with talk of Santa Rallies from some quarters proving premature. We dropped down to the 2 hour support at 7045 as the bell chimed to end the session, then climbing from just above the 7035 long order. Overnight has seen further weakness as the rally looks like a one day wonder.
Stocks in Europe closed the first trading day of December in a sea of green following a 90-day ceasefire in the US-China trade conflict.
The FTSE 100 closed up 82.17 points, or 1.18pc, at 7,062.41 while the FTSE 250 was 83.02 points, or 0.45pc, higher at 18,563.85.
Mining and energy stocks led the rally UK markets, with Antofagasta ending 7.85pc up, or 62.80 points, at 863.20 and Anglo American closing 6.97pc, or 109.20 points, higher at 1,675.40.
In the eurozone the Frankfurt DAX was 1.85pc, or 208.22 points, higher while the Paris CAC was up 1pc, or 50.06 points, at 11,465.46. Oil prices also surged ahead of an OPEC meeting.
Stocks had rallied after the U.S. and China declared a truce in their trade war, while the dollar weakened and oil gained. The benchmark S&P 500 Index jumped more than 1 percent, building on gains posted during the biggest weekly increase in almost seven years, after leaders of the two countries agreed to hold off on new tariffs and intensify trade talks. Treasury Secretary Steven Mnuchin said China has agreed to eliminate tariffs on imported automobiles but declined to give details after President Trump jolted car stocks by announcing a deal had been reached. Trump said in a tweet late Sunday that China agreed to “reduce and remove” tariffs on American-made vehicles, raising more questions about the outcome of his meeting with counterpart Xi Jinping during the Group of 20 meeting in Argentina this weekend. Trump gave no other details in his tweet, which came shortly after he agreed with Xi to the trade war detente. It’s unclear whether China would reduce its car tariffs immediately or as a result of a broader deal. In a briefing in Beijing a few hours after the tweet, China’s foreign ministry spokesman Geng Shuang declined to comment on any car tariff changes.
FTSE 100 Trading Signals, Forecast and Prediction
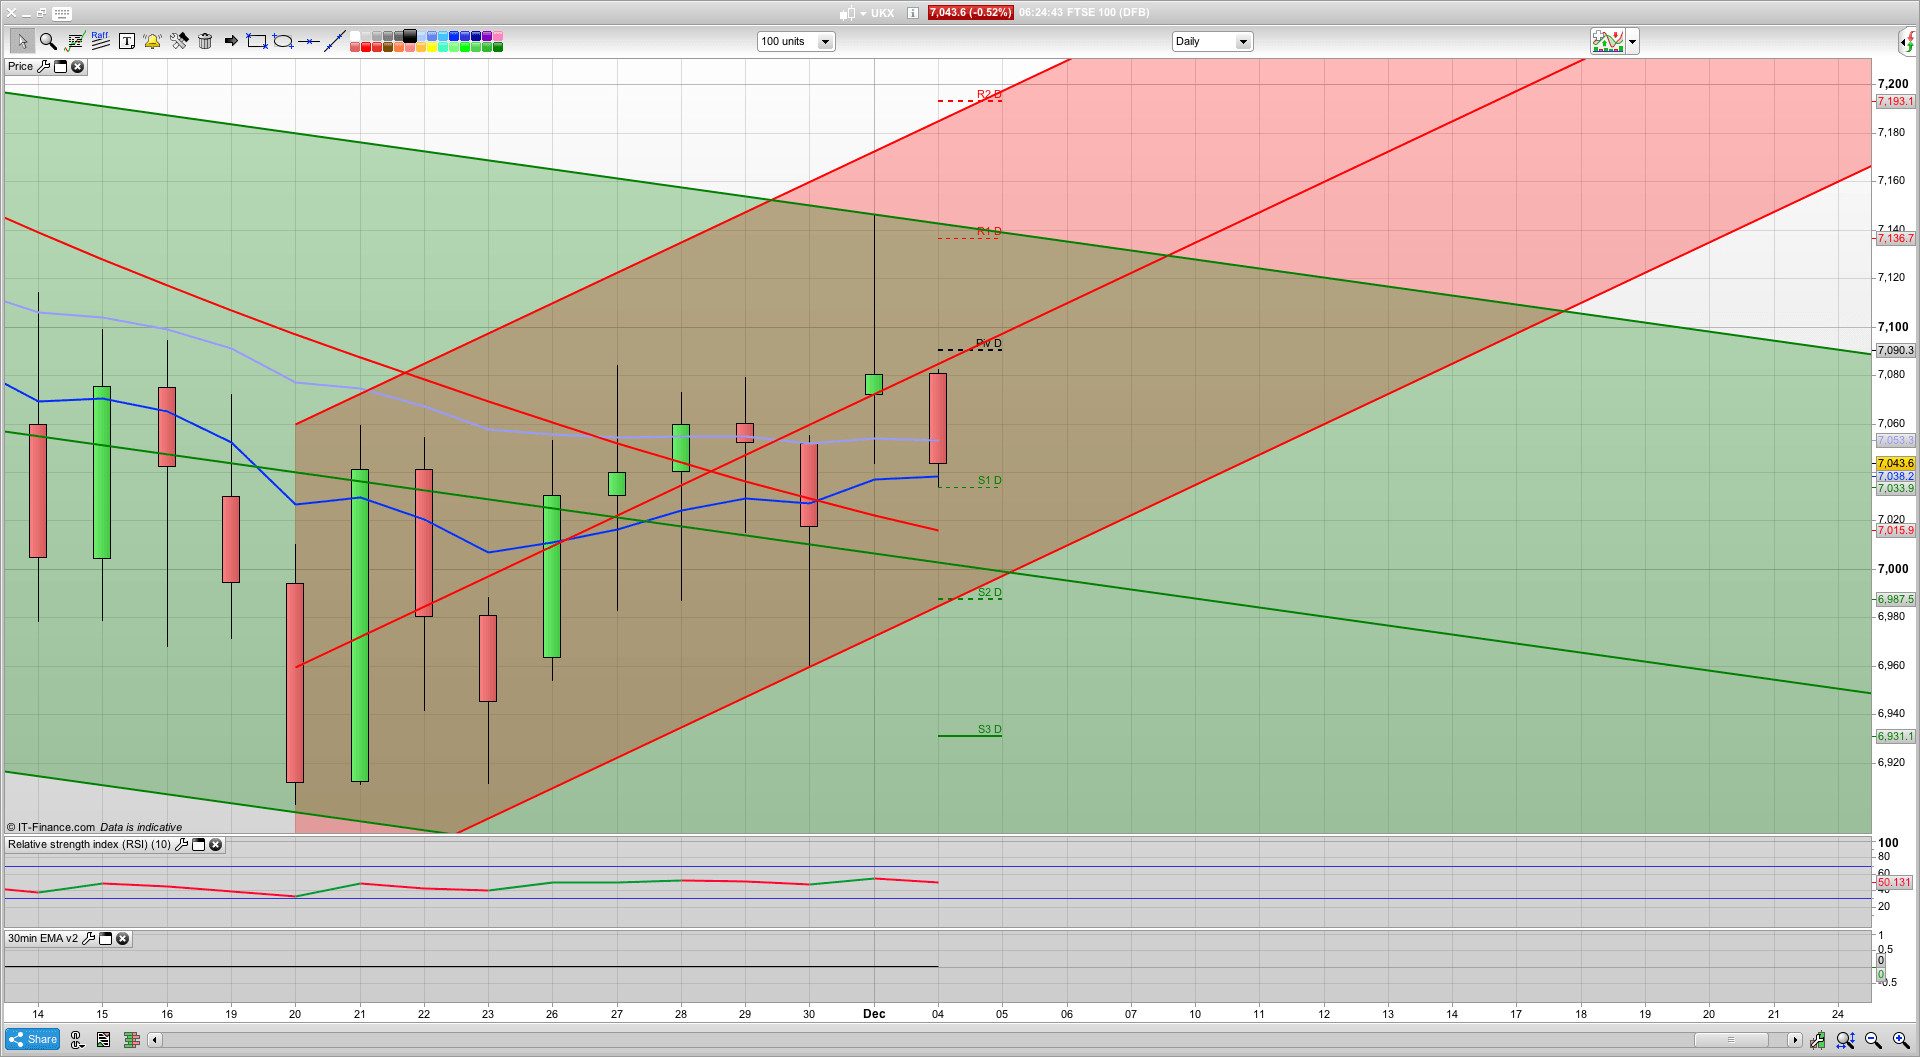
For today I am thinking that we will probably see the gap from Friday get closed which is at 7020 currently. This is also just above the daily support at 7018. If this level holds then we may see a bit of a climb back up towards the 2 hour resistance at 7071 currently, and above this we have the daily pivot and 30min coral for resistance at the 7090 level. The bulls will once again be keen to hold the price above 7000 but should a break of 7010 occur then I am looking at the 6966 level as the next major support. Below this then 6910 should should see a bounce.
Expecting a bit of a bearish Tuesday today, following Asia’s lead, and the ASX200 dropped down to 5700. Asia was a sea of red with more market participants wondering whether the US and China will really be able to settle trade differences in just 90 days. With yesterdays weakness from the 7135 level the 2 hour chart has gone bearish as you would expect and that 7070 level is now the Hull moving average resistance.
If the bulls can break 7135 then a rise to 7215 looks possible, but this level is pretty strong resistance. If we do see that this week then a short here is worth a go. That and 6966 are the wider edges of my support and resistance at the moment. The 25ema on the daily is currently at 7054 and the bulls really need to start keeping prices and daily closes above this if we are to see a year end rally. At the moment, the backdrop is still pretty weak.
The closer levels to watch for today are 7020 initially for support and then resistance at 7070 and 7090 higher up. It could be an interesting day today and we will see if the Asian weakness rolls through into the West. On the flip side, the daily S&P chart is just starting to go bullish with support at 2728, (which is also S3 for today) so worth a long on this here if seen as a possible hold for a few days or longer.
Broker
IC Markets – offers market leading pricing and trading conditions by providing clients with True ECN Connectivity; this allows you to trade on institutional grade liquidity from the world’s leading investment banks, hedge funds and dark pool liquidity execution venues. Highly recommended!
Membership
If you would like more detailed analysis for FTSE 100, DAX, Gold and S&P, including the trades that I am looking to take myself, then please join my active members community.
What you get
- Daily Analysis pre market open (sent around 7am each day) for FTSE, DAX, Gold and S&P.
- Daily email pre market includes my trading plan for the day including ORDER levels, with stops and targets/limits
- Telegram Chat room and webinar group membership for discussion and realtime trade updates