
Support 6152 6140 6130 6104 6093 6082 6076
Resistance 6182 6194 6225 6249 6251
Market Summary for Friday 4th March 2016
The FT100 was boosted by the market’s mining sector which climbed to a four-month high on Friday, boosted by a rally in the prices of major industrial metals.
The index also benefited at 1:30pm from a surge in U.S. non-farm payrolls, a sign of labour market strength that could further ease fears the economy might be heading into recession.
Both managed to push the FT100 to a close very near to the 6200 level with strong investment demand from 3:30pm into the close.
Commodities was the clear leading sector with interest rate sensitive sectors such as retail and house builders to the downside.
Trade wise, the early short at 6180 was a bust but the 6200 later in the day that was triggered by the NFP news ran nicely down for decent profit, before the bulls retraced that fall to hit a high at 6220. The S&P Long triggered at 1988 on the NFP news and rose well, to 2009 in the end. We have since fallen back a bit to 6170 this morning on the FTSE 100 though.
US & Asia Overnight from Bloomberg
- Copper, Aussie retreat as technical gauge points to declines
- Japanese equities fall with U.S., U.K. stock index futures
Asia’s emerging-market stocks and currencies advanced while oil rose above $36 a barrel after Friday’s U.S. jobs report brightened the outlook for global growth.
The MSCI Asia Pacific excluding Japan Index climbed to a two-month high, while Japan’s Topix and U.S. stock index futures declined for the first time in a week. Malaysia’s ringgit and Indonesia’s rupiah rose to their strongest levels since at least August. Australia’s currency and copper retreated as a technical indicator signaled recent rallies were excessive. Crude advanced to a two-month high in New York, after surging by about 10 percent in each of the last two weeks, while iron ore prices jumped in China.
The latest U.S. jobs figures added to a string of reports that have sketched out a picture of relative health in the world’s biggest economy, helping spur a rebound in global stocks and commodities that began in mid-February. China’s leaders set an expansion goal of 6.5 percent to 7 percent for 2016 at an on-going annual meeting of the legislature, down from last year’s target of around 7 percent, and said they are planning a record-high budget deficit.
“The U.S. recovery remains intact and we have not had a global recession without a U.S. recession in probably 100 years,” Matthew Sherwood, head of investment strategy at Perpetual Ltd. in Sydney, which manages about $21 billion, said in an e-mail to clients. “But I still think that despite the solid risk recovery over the past three weeks, returns are likely to be very modest in 2016, at best, and downside protection will be needed.”
China’s National People’s Congress continues on Monday, when data on the country’s foreign-currency reserves is due. A trade report out of Taiwan is scheduled, while India’s financial markets are closed.
Stocks
The MSCI Asia Pacific excluding Japan Index gained 0.5 percent as of 2:47 p.m. Tokyo time. The Shanghai Composite Index added 0.2 percent, while benchmarks in Malaysia, South Korea and Thailand were headed for their highest closes of the year. The Topix declined 0.9 percent, after surging 15 percent over the last three weeks.
“We’re at a level where we can easily get selling,” said Yoshinori Ogawa, senior strategist at Okasan Securities Co. “There are concerns over earnings, and I get the impression that moves to buy back happened in a state of wariness. Long-term funds probably haven’t come in yet.”
Australia’s S&P/ASX 200 Index gained 1 percent, climbing for the sixth day in a row. BHP Billiton Ltd., the world’s biggest miner, jumped 5 percent after surging 13 percent last week.
Standard & Poor’s 500 Index futures slipped 0.2 percent, while contracts on the U.K.’s FTSE 100 Index fell 0.4 percent.
Currencies
The ringgit gained as much as 1.1 percent to 4.0765 per dollar, the strongest level since August. The increase in crude prices is brightening prospects for Malaysia, Asia’s only major net oil exporter. The rupiah strengthened for a 13th day, its best winning streak since 2010.
The yuan fell 0.1 percent, snapping a four-day run of gains, as China’s leaders refrained from announcing specific support measures for the exchange rate at their biggest gathering of the year.The nation will push ahead with efforts to make the currency more convertible and promote its use overseas over the next five years, according to a development plan released at the National People’s Congress on Saturday.
Australia’s dollar fell 0.4 percent, after a 4.4 percent weekly surge that marked its best performance since 2011. The currency’s 14-day relative strength index was 70 at the end of last week, a threshold that indicates to some traders a reversal of direction is likely.
The Bloomberg Dollar Spot Index, a gauge of the currency against 10 major peers, was little changed after falling for a fifth day on Friday. Odds of the Federal Reserve raising interest rates by December ticked up after the payrolls data, with the probability at 68 percent, up from 53 percent a week ago and 49 percent a month ago, according to Fed funds futures tracked by Bloomberg.
Commodities
West Texas Intermediate crude climbed for the fifth time in six days, rising 1.8 percent to $36.57 a barrel in New York. It’s headed for the highest close since Jan. 4. Speculators reduced their short positions by the most in 10 months in the week ended March 1, CFTC data show.
Signs the Organization of Petroleum Exporting Countries will act to address the global surplus that has depressed prices for at least the past year is buoying oil, along with a decline in the number of active rigs in the U.S. The number of rigs has plunged 75 percent since September 2014 and ended last week at the lowest level since 1999, datashow.
“We’re starting to see U.S. production levels decline and if that continues, it could easily drive momentum in oil a bit further,” Ric Spooner, a chief analyst at CMC Markets in Sydney, said by phone. “Still, the higher prices go, the more vulnerable they are to some sort of correction, given we’re moving into a period of seasonal weakness.”
Copper fell 1.2 percent, after closing above $5,000 a ton last week for the first time in four months. It’s relative strength index was 76 on March 4, above the 70 level that indicates a likely change of direction. Investors in the metal shifted to a net-long position on March 1 for the first time in four months, weekly data show.
Iron ore futures jumped to their daily limit of 407 yuan ($62.47) a metric ton on the Dalian Commodity Exchange, up 4.9 percent and the highest level in almost six months. Steel in China also rose by the daily limit, with steel reinforcement bars for May up 5 percent to 2,073 yuan a ton on the Shanghai Futures Exchange.
The Bloomberg Commodity Index rose 0.1 percent, after a 3.9 percent gain last week that marked its biggest advance since July 2012.
Bonds
Australian bonds led declines among sovereign debt, with yields on notes due in a decade climbing three basis points to 2.58 percent. The rate on similar-maturity U.S. Treasuries increased by one basis point to 1.89 percent, after adding four basis points on Friday.
The cost of insuring Asian corporate and sovereign debt fell to a two-month low, with the Markit iTraxx Asia index of credit-default swaps retreating one basis point to 146 basis points, according to prices from Australia & New Zealand Banking Group Ltd. [Bloomberg]
FTSE 100 Outlook and Prediction
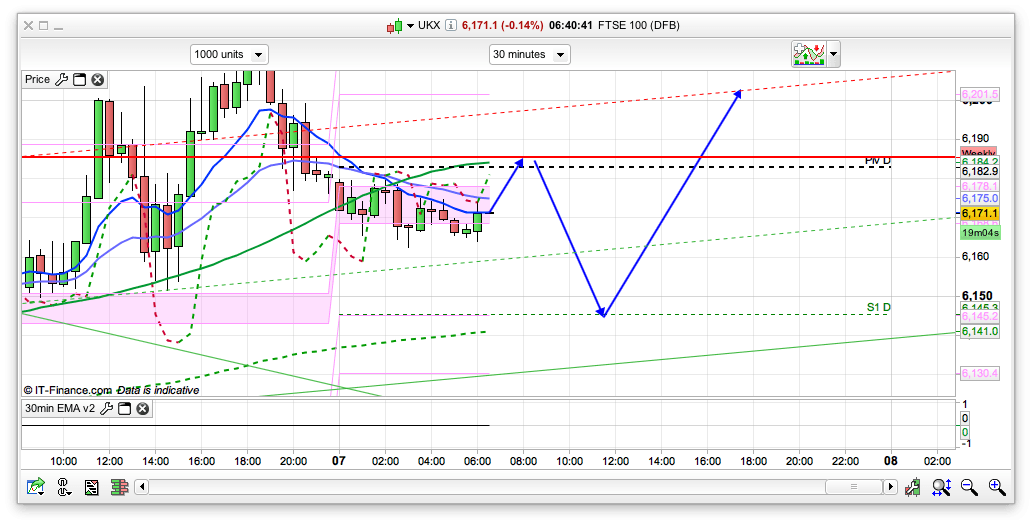
Mondays recently have been fairly optimistic and looking at the 30min chart there is decent support around the 6130/6140 area. NFP on Friday came in better than expected and the market wasn’t sure how to react really, hence the drop then rally. Raises prospects of rate rises, despite words that they aren’t coming in the short term. For today the pivot is 6182 and we have a bearish 30min chart to start with. As such I am expecting a dip from the pivot area to test the 6145 area and then if we repeat the usual Monday bull pattern, a rise from there to maybe test 6200, and possibly Fridays high at 6220. However, I am wary about getting too bullish as I still think we have come too far too fast and think we should have a pull back towards 5700. That said, the 2 hour chart has gone bearish despite that rise on Friday and is showing resistance at 6194. So for today I am thinking that a dip from the pivot area, down to the 6145 support area before another rise to test 6194, possibly 6220. I am favouring the bearish side for this week though.
Morning all,Dax is playing around Thurs close which is also the S1 area and theres a bit of a distance between here and other levels,so this needs someone to make a decision,hopefully not a politician outside the Eurogroup Meeting looking for 5 mins on tv.
Morning, hope you all had a good weekend. Snowing heavily here.
Looks like Nick’s channel held ok in the high 50’s but not much of a bounce so far.
Eyes on that and 9720 DAX holding today or there’s a bit of a hole down to the 20’s for me. Understandably the upside is rejecting the 200’s after the big rise and I’m pretty neutral in this area but I guess it’s buy the dips carefully, bearing in mind it could pull back to at least the low 6000’s without spoiling the bull party at all.
Morning All,
Still expecting a dip to 630-70 area on the Dax before more upside, Got a short from 760 with a 20 point stop. Got stopped twice on Friday expecting that drop and missing the long in turn. Will it get it today ?
Just noticed it has dropped like 20 points while I was typing the previous comment. Stops now at 770 and target is at 670.
Took half at 720 for 40 points and moved the target to 640. Stops still at 770.
good morning RJ, Just went long 690, you really think this could go to 640?
Hi Dutch,
It is a possibility, my theory and also from experience it always goes a down/up a bit further before reversing to take out stops. 630 is 50% retrace.
I wouldn’t be surprised even if we get a sharp dip to 565 (61% retrace) before ECB.
Longer term trend is up. It could be a trending down day today. Now that your position is in profit best to leave it at b/e (take some profit if big position size) and run it. What is your target ?
Target is 10k+ but agree things could go bit lower if ECB Dragi don’t deliver. Might take some profit if we get to 840
ok you have a longer term position in that case its fine. Where is your stop ? My short is not for longer term, it is just for today may be tomorrow and see where the price closes if it doesn’t get stopped out. I’m still waiting for a dip to go long for 10K plus target so no rush.
Stop at 650 but it depends as I might be tempted to then let it drop and add, dpeneds a bit on what happens with ECB et al
It doesnt seem right that the Australians could come back from a Holiday weekend and find they are above their downtrend.
Heres a cartoon from them you might like tmfp,if you didnt see it before.
https://pbs.twimg.com/media/Ccs4qtaUYAA58Qm.jpg
Maybe a run down too 6000 ish on ftse then a spring board to 6280 ish
Morning All, bit late this orning, no snow but proper cold. Just closed DOW short at 16940, 60 points of not a lot. Going to run the FTSE short but closing limits in at 6100, 6075, 6050. That said, I would like to be out of everything by Thursday if at all possible.
I don’t think we’ll see it down to 5700 in the medium term but it should get to 6000 before getting bullish again – just musings!
Good luck all!
Morning all,I’m looking at the daily chart Ftse.im trying to improve my T/A it looks to me like it could drop to 6113 then possible 6067….. That’s what I’m seeing,any thoughts from anybody?
Hi anstel, what’s your thinking behind those targets, what indicators etc. tell you that?
Hi tmfp. Well on the daily chart the RSI is dropping along with the other oscillator I have on screen which is MACD….I drew a line across and the top of the bodies of two candles from end of Jan line up with the tops and tails of candles from 26-27 feb and three days ago.Maybe a bit agricultural but I’m trying to learn this TA better.i do think we are due some consolidation but that’s only my opinion
Forgot to add the 10 SMA is slightly above the 6113 level at about 6118 so I figured it could drop to here first.
Fair enough. Are you using cash or 24/7 charts?
There is an uptrend line around here on the daily, are you watching that too?
Talking of trend lines, the DAX has broken its 90 min long morning uptrend, come back and tried to break back up twice and failed. Breaking 720 might be significant for another 20 pts and would put more pressure on us for a visit to the 20’s.
It’s based on the 24/7 brokers chart but I also have the FTSE chart open on investing.com the one you showed me with the volume bars,I’m not totally familiar with this investing.com chart yet though.still learning about that.After watching Nicks video on the Raff channels on the PRT chart and some of Hugh’s charts the PRT charts look interesting,I need to find out what they cost……do you get PRT charts free with I.G?…….I also check the Bianca channel now as well. There’s alot to learn.
Yes, PRT is free on IG if you’re active and you can also format it for cash hours only if you want.
Bearing in mind that a chart and its indicators are only a summation of data, it does bear thinking about, certainly for longer term stuff, exactly how much relevance should be attached to out of hours input, especially if you think gaps are significant.
The uptrend line on the Daily Tmfp yes I see that,I’m not sure how to draw it on the chart as a channel as yet but it appears it makes the 6113 level below the rising channel.its not easy reading these charts.
Nice mini 1min rsi divergence on FTSE there at 40/42, coinciding with 9740 holding as prev high resistance on DAX. Back to 9720 support for a bounce/fail choice again.
IF a bit of momentum gets going downside, still looking to turn round to long around 6120 before the DOW.
Re trendlines, you don’t have to turn them into a channel or expect them to exactly hold.
I look for them to hold obviously, as a measure of how ready buyers are to continue to buy pullbacks/sellers to sell rallies.
Intraday breaks of trend followed by sideways action tell me the momentum has gone but the move isn’t necessarily over, but a failure to regain them can signal a temporary top/change of direction, in conjunction with lateral areas of support/resistance e.g. the DAX over the last hour or so.
I missed that divergence on the 1 min chart…..I was looking at longer timeframes when it jumped….so to just draw a trendline do you take a line through the centre of a predetermined number of previous candles ….or do you just look for a series of higher highs and higher lows if it’s bullish…..and conversely if it’s bearish?
I’m still trading as well tmfp….I just gained +17pts on a pair of long positions….out on your RSI 10 overbought…..thanks tmfp.
Trendlines, you can draw them either connecting the open or close candle bodies or the high or low tails or both, if you want a resistance band.
Pretty aimless stuff at the moment, I wonder if there’s one more test of 6130 in it before the DOW?
Horrible performance on FTSE so far, 80 off the opening highs and no bounce to speak of all morning.
Thanks for explaining trend lines tmfp appreciate it,…..regarding today’s ftse it’s very unsure of itself.speaking purely from opinion we have come a long way since 5500….. The Dow was approaching 17050 on Friday from memory…..I would have thought we could get a sell off when the Dow opens then a possible bounce……..so I’m waiting and watching at present.
Added to the Dax short at 732 average open 745 stop at 770.
Interesting RJ, must say the bounce so far is not entirely convincing so who knows..
If 690 breaks, we might see 630 today.
Took 12 points on the added position. Don’t want to mess the position with tricky down opening. One open position at 760 still waiting for a drop.
I have taken some profit as it is tricky either way. Still I think end of week we will be near or over 10k
Mine got stopped out for 10 points, Overall had 30 points. Yes 10K by end of this week.
Wonder where we will go when the DOW opens…will the drop continue..
i think we will have a slight drop, i expect a more bumpy ride tomorrow.
afternoon all.
Tmfp – is Brian coming out to play soon?
Lol, hello custard.
Not for the foreseeable mate, I’ve ditched longer term forays, better the devil I know, just scalping at the mo. Tbh, I don’t need the stress.
I am short today, have been all morning, patiently waiting for this third attempt at breaking 30 to succeed then start looking at the long side maybe.
Don’t like the calendar this week, too many bad news to be dressed up as good possibilities.
Good to hear about the blue ink. GL.
All I can think of is Life of Brian! Release Brian!
If the DOW comes in around here 930, then I reckon there are 60 points either way of nothingness, so only a skeleton short now after those 2 min hammers at 13.56.
Well, used up the +60 of upside pretty quick and lined up with a slightly o/bought ftse short at 54, where now is the question?
If it doesn’t retest 90 pretty quick then it looks like your DOW standard opening runup and 900 target downside which pressures our lows again.
good call earlier
Ta.
Should be looking at buying even small dips I guess with 17072 next target around 6180 for us, but I can’t bring myself to do that, doesn’t feel kosher this rally.
Sitting on paws, looking for overbought short entry.
trying 66
I expect a drop off when the US opens, what do you guys think?
well i was wrong
We will see. Long way to go yet… 6000 or 6400!!
Wonder which we will see first!!
Any chart specialist tell me how it’s looking?
Thanks.
Plenty of them about…..what would you like to hear? 🙂
It might be that I don’t what I am on about but how do you scalp FTSE on overbought and oversold conditions, TMFP? Say you’re using a 1 minute timeframe and expect there to be a bounce off the oversold, are you only using RSI? But can’t something stay oversold or overbought longer than you anticipate? At what point is the indict ion there? Also, how much do you scalp off 1 minute charts? Is it enough to beat the spread? Because if you look at average true range on one minute they are usually a couple of points or so. Or do you use the one minute chart to look for possibility the overbought or oversold conditions coming coming to an end. Like I say, what I might be saying here might be completely irrational (not make sense at all to you), so I’d appreciate your input on this. Thanks
It’s a pretty blunt instrument, but basically I try to get in front with a good entry based on rsi, previous high/low and wider considerations, take a profit asap on half the position and either add that back onto a stop for the balance or trade them out.
Obviously it depends on context but I’ll trade the extremes >80 <20 pretty much every time and add if it continues.
Trending days can be expensive, like any system when you get it wrong, but on average it pays for me. It's a very short term reversion to mean approach and counter trend by nature, although it works both ways and can give you an entry within the trend too.
I also watch the other main index trading, up to 14.30 the DAX and after that the DOW and use their action as pointers for likely corresponding FTSE moves.
You've got to be quick on your feet counter trend trading with close stops, but at the same time be aware that you will luck on a change of trend i.e. pick a top/bottom and maximise that when you do.
Bought half of Dave back at 58 for squat diddly having been looking at quite a bit earlier, look to reshort at 200.
Won’t get there chippy before it turns down
Dunno, might have panicked a bit watching the rise and a couple of quid in my bin is better than in someone elses. Like tmfp says, it can get a bit wearing having a big-ish position, sweating it and then only nicking pennies but keep on bashing and I’ll break through!
I’ve said this before but I’m really not a chart reader/day trader and am more likely to have a plan for the year rather than the day! I think I said in late December that I reckoned 6500 at the end of ’16 but with a visit to 5700 before. I slightly bottled it at 5550 or whatever but probably still think the same. Here we go!!
MHH coming up, nothing obvious to look at apart from approximate 50% retrace on the day resistance being neutralised by a firm DOW. Sitting with a 74 short on b/e at the mo, running till around 16.28 or stopped.
Is there any resistance levels are the graphs? I expect the retrace to old today but it’s looking like its wanting to finish above 6200 again…
Still holding a short…:(
Brenda Kelly on Draghi
http://www.digitallook.com/news/expert-view-4/leave-it-all-to-mario–1064857.html
Anyone got any good book recommendations? In fairly new to this and really want help reading daily trends etc…
what would be a good time in the morning to place first trade for the ftse? before
07.00 hours? i like early mornings.
Europe is active from 7,but if you want to go outside of FTSE hours,especially pre 7as a normal routine not just for some specific thing that is happening,might be easier to look at a different mkt.Maybe look at what is open at a time that suits you and pick something you like,costs,spreads all vary a bit and some of them move differently.
http://www.cleanfinancial.com/stock_market_opening_and_closing_times.php
thanks!
What time does the ftse reset? Is it just once a day at 430?
Cash mkt is 8 to 16.30,everything else is a debate on here about what it is/means,if you want something you can actually walk away from knowing it is shut and not moving on a screen then France is the easiest mkt.
Thanks. So just for clarity the ftse is currently about 0.02% down…will that revert to 0 at 8am and again at 430pm. If that makes sense?
Some of the SB co’s will quote % numbers from their Trading breaks,that is just them though.Some pay dividends at 16.30 and some do it late night,the only official numbers are running 8 to 16.30,easier to track the position yourself relative to high,lows,open and close etc etc imo.When S/B co’s do things like that it isnt necessarily to help you eg they all have Calendars of Econ data as a service to help,but they dont include everything that isnt on a cycle,eg Central Bankers talking frequently isnt there,Carney 09.15 tomorrow isnt on City’s calendar,but he’s talking.Ftse was down 17 points today,Cash mkt at 21.00 it was about 27 points down on the day,but that isnt official.
How they create the out of hours mkt is a bit unclear,clearly it is a proxy for other stuff and it is influenced by trading etc etc,but most people are contemptuous of the IG Sunday mkt and essentially out of hrs is the same thing.Sorry hope that makes sense,have to break myself and come back in a couple of hrs.Have a good evening all.
That’s great. Thanks.