
Technical analysis for 26th May 2026
FTSE 100
- Bias: Neutral → slight bullish
- Observations:
- Still trending higher overall
- Red candle at resistance after multiple bullish days
- Less strength than DAX/US indices
- Observations:
- Levels:
- Support: 10,505 → 10,456
- Resistance: 10,588 → 10,623 → 10,672
- Trade idea:
- Prefer waiting for either:
- breakout above 10,550–10,590
- pullback into support
DAX40
- Bias: Bullish (buy-the-dip)
- Observations:
- Strong series of higher highs / higher lows
- Price remains above rising EMAs
- Small red candle after strong upside move = more like consolidation than reversal
- Trading above daily pivot
- Observations:
- Levels:
- Support: 25,260 → 25,070
- Resistance: 25,530 → 25,713 → 25,984
- Trade idea:
- Prefer longs on pullbacks into 25,250–25,300
- Bullish structure invalidated below 25,070
NASDAQ
- Bias: Slight bullish / range-to-bullish
- Observations:
- Trend still intact
- Price sitting near upper trend structure
- Small indecision candle after strong advance
- Near resistance area
- Observations:
- Levels:
- Support: 29,655 → 29,564
- Resistance: 29,878 → 30,010 → 30,101
- Trade idea:
- Buy dips above 29,650
- If 30k breaks, momentum could accelerate
- Avoid chasing directly into resistance
S&P 500
- Bias: Bullish
- Observations:
- Strong upward channel
- Higher lows maintained
- Momentum remains constructive
- Observations:
- Levels:
- Support: 7,508 → 7,493
- Resistance: 7,547 → 7,569 → 7,585
- Trade idea:
- Buy pullbacks
- Above 7,500 trend remains healthy
GOLD
- Bias: Bearish
- Observations:
- Still trapped inside descending channel
- Trading below falling EMA structure
- Rejection at pivot/EMA area
- Observations:
- Levels:
- Resistance: 4,580 → 4,598 → 4,616
- Support: 4,539 → 4,530 → 4,498
- Trade idea:
- Sell rallies into resistance
- Below 4,580 downside pressure remains
Session outlook
- Europe open: likely mildly bullish
- US session: bullish continuation favoured unless NASDAQ loses 29,650
- Gold: likely weak if equities stay bid
- Primary directional play today:
- Long indices / short gold rather than trying to fade the trend.
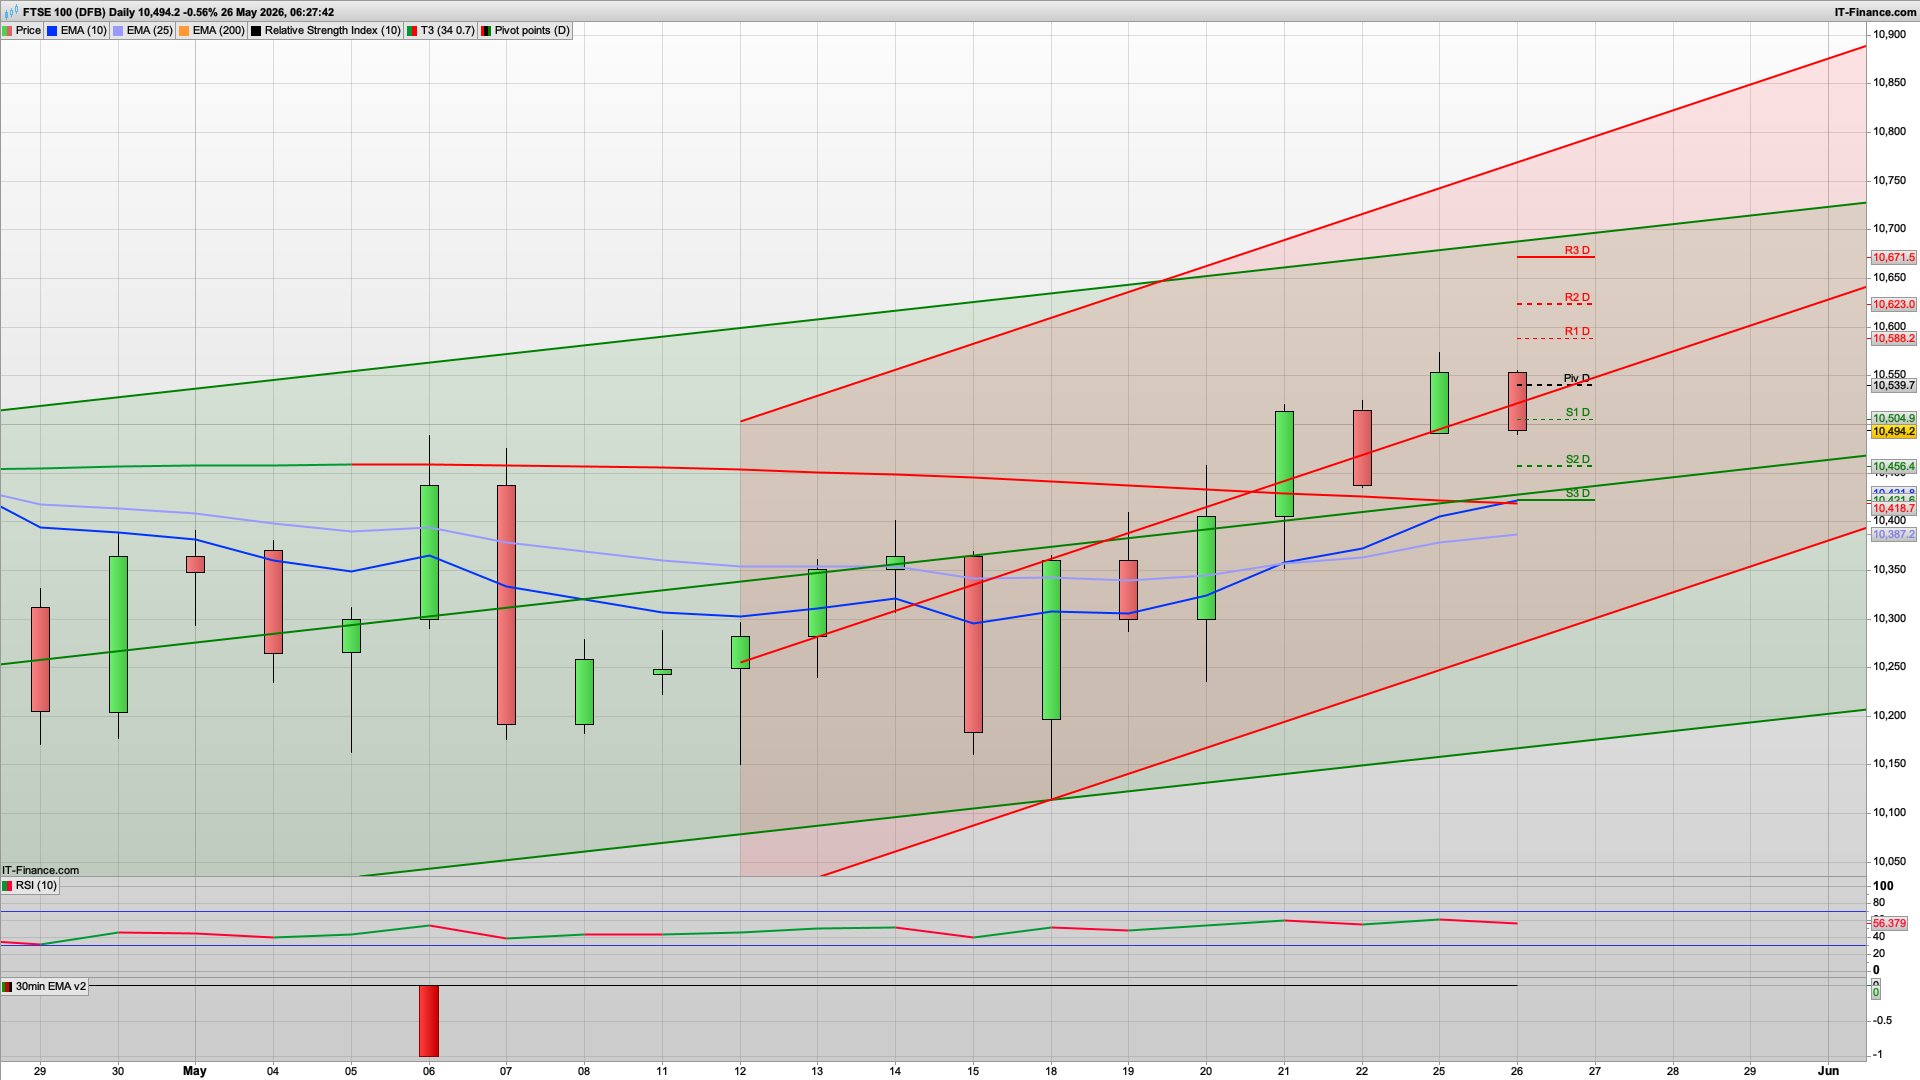
Bear Tuesday has kicked in well from the 10572 resistance area we had penciled in on Friday, and the bears will be keen to keep that going. Once again the fragile "peace" and "negotiations" are driving the markets and today we have seen oil rise and stocks drop again.
Initially for the FTSE100 we may well get a kick up and the daily pivot level at 10539 looks the key resistance to start with, as we also have the red 30m coral here. If the bulls were to break above this then another test of the 10572 is likely, and we also have R1 at 10588. The bulls may well struggle to push past this today unless news driven though, as caution and bearish vibes persist.
Support initially is at the key fib at 10474 and 200ema 10462, and with S2 just below this at 10456 I would like to see this area hold. In an ideal world the bulls will be looking to build on the rise, and yesterday's bullishness, and buying the dip is still the slightly preferred option.
If the bears were to break below the 10450 level then 10390 is the 25ema on the daily chart and longer term support, with 10360 daily support lower down. I am not expecting it to get that low though.
Half term week in the UK also so slightly reduced volumes are likely and no major scheduled UK centric news.
Interested in how to start trading the FTSE 100? Frequently Asked Questions on Spread betting
Recommended Broker for trading - MT4/5, web and mobile

IC Markets - offers market leading pricing and trading conditions by providing clients with True ECN Connectivity; this allows you to trade on institutional grade liquidity from the world’s leading investment banks, hedge funds and dark pool liquidity execution venues. Highly recommended!
Join my Membership for Trading Tips, Support and Resistance Levels with Live Trading
If you would like more detailed analysis for FTSE 100, DAX40, Gold and the S&P500, including the trades that I am looking to take myself, then please join my active members community.
Keep up to date with new website posts, free sign up below
