
Technical analysis for 24th June 2026
There has been a subtle shift overnight. The US indices remain the weakest group, Gold remains decisively bearish, while the DAX is still the strongest index despite losing momentum. The FTSE is trying to stabilize around its moving averages.
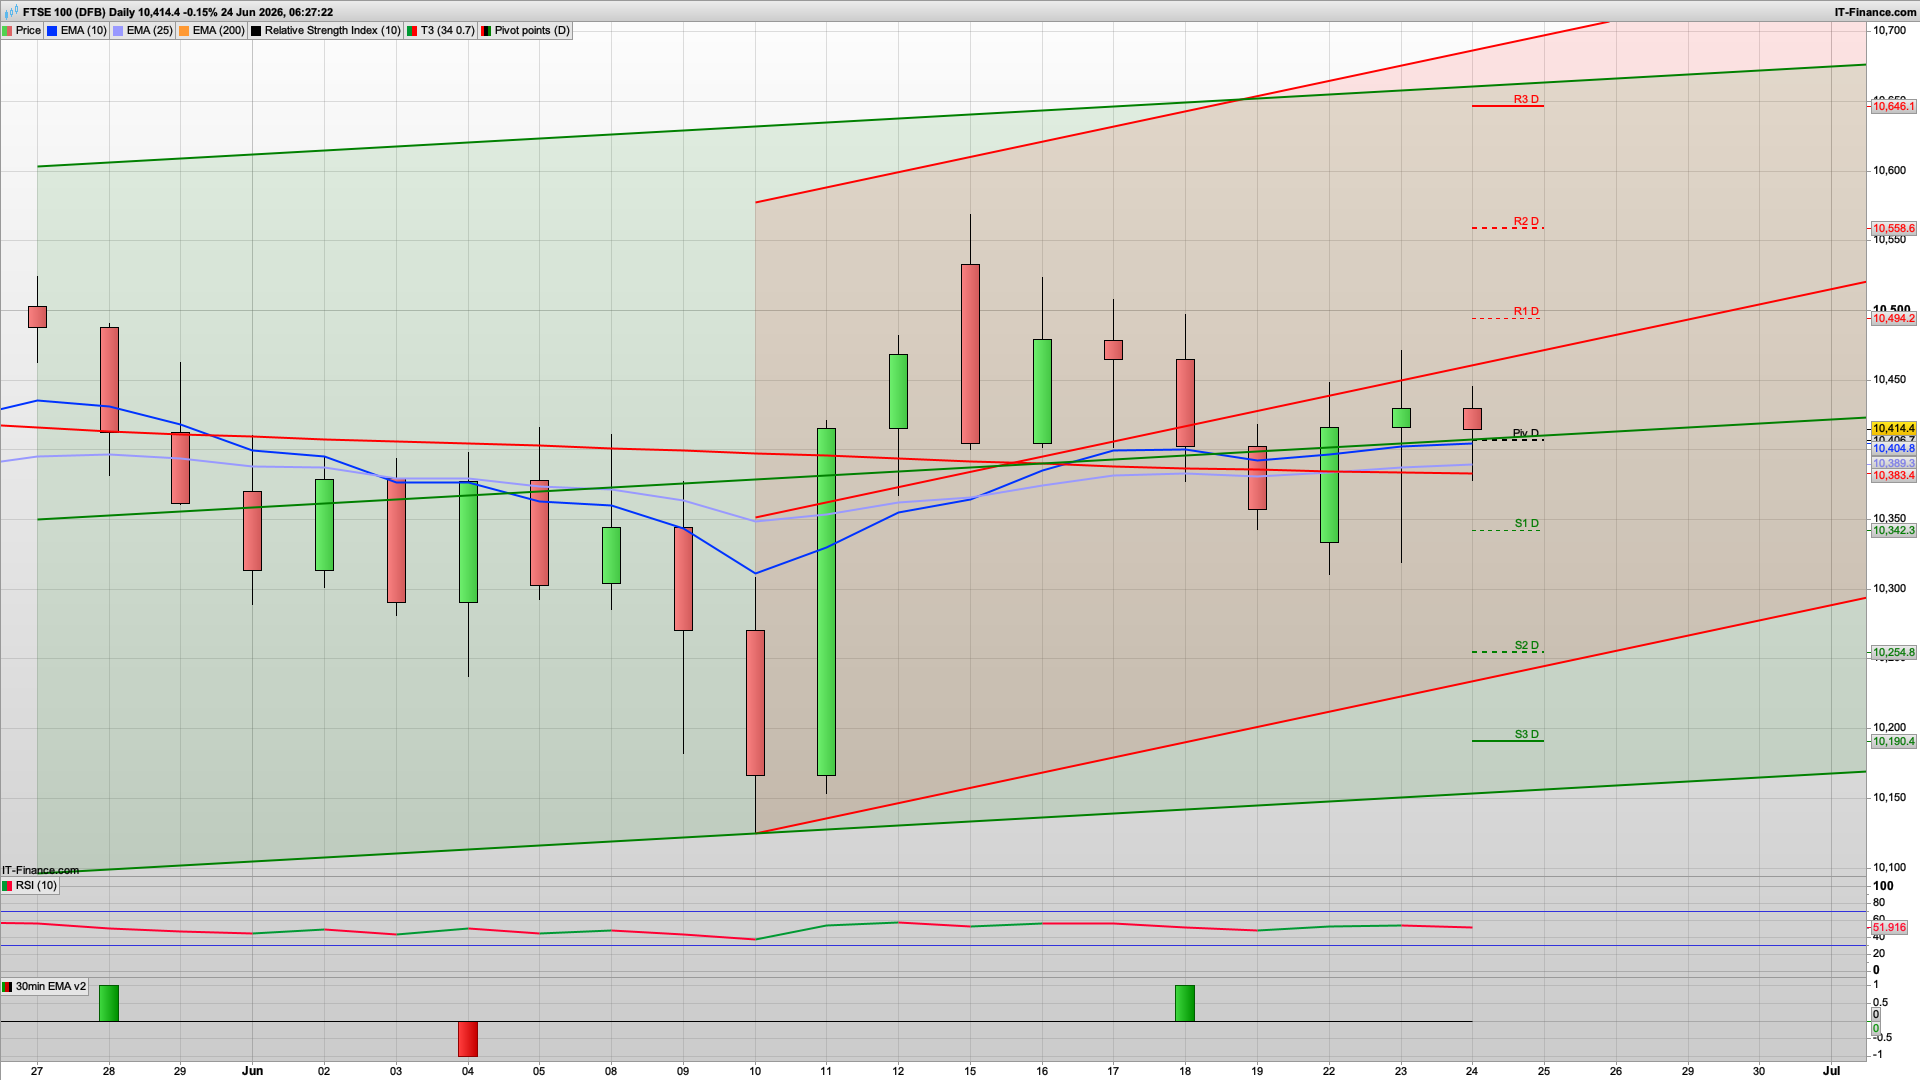
FTSE 100
- Bias: Neutral → Slight Bullish
- Price sitting directly on the EMA cluster.
- Above the daily pivot.
- Channel structure still intact.
- Not showing the same weakness as US indices.
- Key Levels
- Resistance:
- 10,494 R1
- 10,559 R2
- 10,646 R3
- Support:
- 10,404 Pivot
- 10,389 EMA support
- 10,342 S1
- Resistance:
- Trade Plan
- Above 10,400 favors buying dips.
- Below 10,340 turns bias bearish.
DAX 40
- Bias: Mild Bullish
- Price remains above the rising EMA25 and EMA200.
- Still trading inside the ascending channel.
- Holding above the EMA25 around 24,870.
- Yesterday's selling failed to break support.
- Key Levels
- Resistance:
- 25,006 R1
- 25,276 R2
- 25,456 R3
- Resistance:
- Support:
- 24,873 EMA25
- 24,757 S1
- 24,586 S2
- Trade Plan
- Above pivot (24,903) favors longs.
- Pullbacks into 24,850–24,900 likely attract buyers.
Nasdaq 100
- Bias: Bearish
- Still below the falling EMA25.
- Lower highs remain intact.
- Trading beneath R1 and well below recent highs.
- Weak bounce after yesterday's sharp decline.
- Key Levels
- Resistance:
- 29,687 Pivot
- 29,943 R1
- 30,441 R2
- Support:
- 29,107 S1
- 28,774 S2
- Resistance:
- Trade Plan
- Sell rallies into 29,700–29,950.
- Bullish only above 30,000.
S&P 500
- Bias: Bearish
- Strong bearish breakdown over the last two sessions.
- Trading below both EMA25 and EMA10.
- Momentum remains negative.
- Current bounce looks corrective rather than impulsive.
- Key Levels
- Resistance:
- 7,392 Pivot
- 7,434 R1
- 7,487 R2
- Support:
- 7,339 S1
- 7,297 S2
- 7,244 S3
- Resistance:
- Trade Plan
- Sell rallies into 7,390–7,435.
- Downside target 7,340 then 7,300.
Gold
- Bias: Strong Bearish
- Clear downtrend remains intact.
- Below EMA25 and EMA200.
- Price sitting near S1 after another selloff.
- Lower highs and lower lows continue.
- Key Levels
- Resistance:
- 4,131 Pivot
- 4,172 R1
- 4,239 R2
- Support:
- 4,064 S1
- 4,024 S2
- 3,956 S3
- Resistance:
- Trade Plan
- Sell rallies into 4,130–4,170.
- Downside target 4,025 then 3,960.
Other Opportunities Today
- Best Long
- DAX
- Buy dips above 24,850
- Target 25,050 → 25,275
- DAX
- Best Short
- Gold
- Sell below 4,130
- Target 4,025 → 3,960
- Gold
- Second Best Short
- Nasdaq
- Sell rallies into 29,700–29,950
- Target 29,100
Market Theme
The daily charts suggest a Europe stronger / US weaker environment. DAX and FTSE are holding trend support, while Nasdaq and S&P continue to trade with bearish daily structures. Gold remains the cleanest trending market and continues to favor selling rallies rather than trying to pick a bottom.
Interested in how to start trading the FTSE 100? Frequently Asked Questions on Spread betting
Recommended Broker for trading - MT4/5, web and mobile

IC Markets - offers market leading pricing and trading conditions by providing clients with True ECN Connectivity; this allows you to trade on institutional grade liquidity from the world’s leading investment banks, hedge funds and dark pool liquidity execution venues. Highly recommended!
Join my Membership for Trading Tips, Support and Resistance Levels with Live Trading
If you would like more detailed analysis for FTSE 100, DAX40, Gold and the S&P500, including the trades that I am looking to take myself, then please join my active members community.
Keep up to date with new website posts, free sign up below
