
Technical analysis for 14th May 2026
FTSE 100
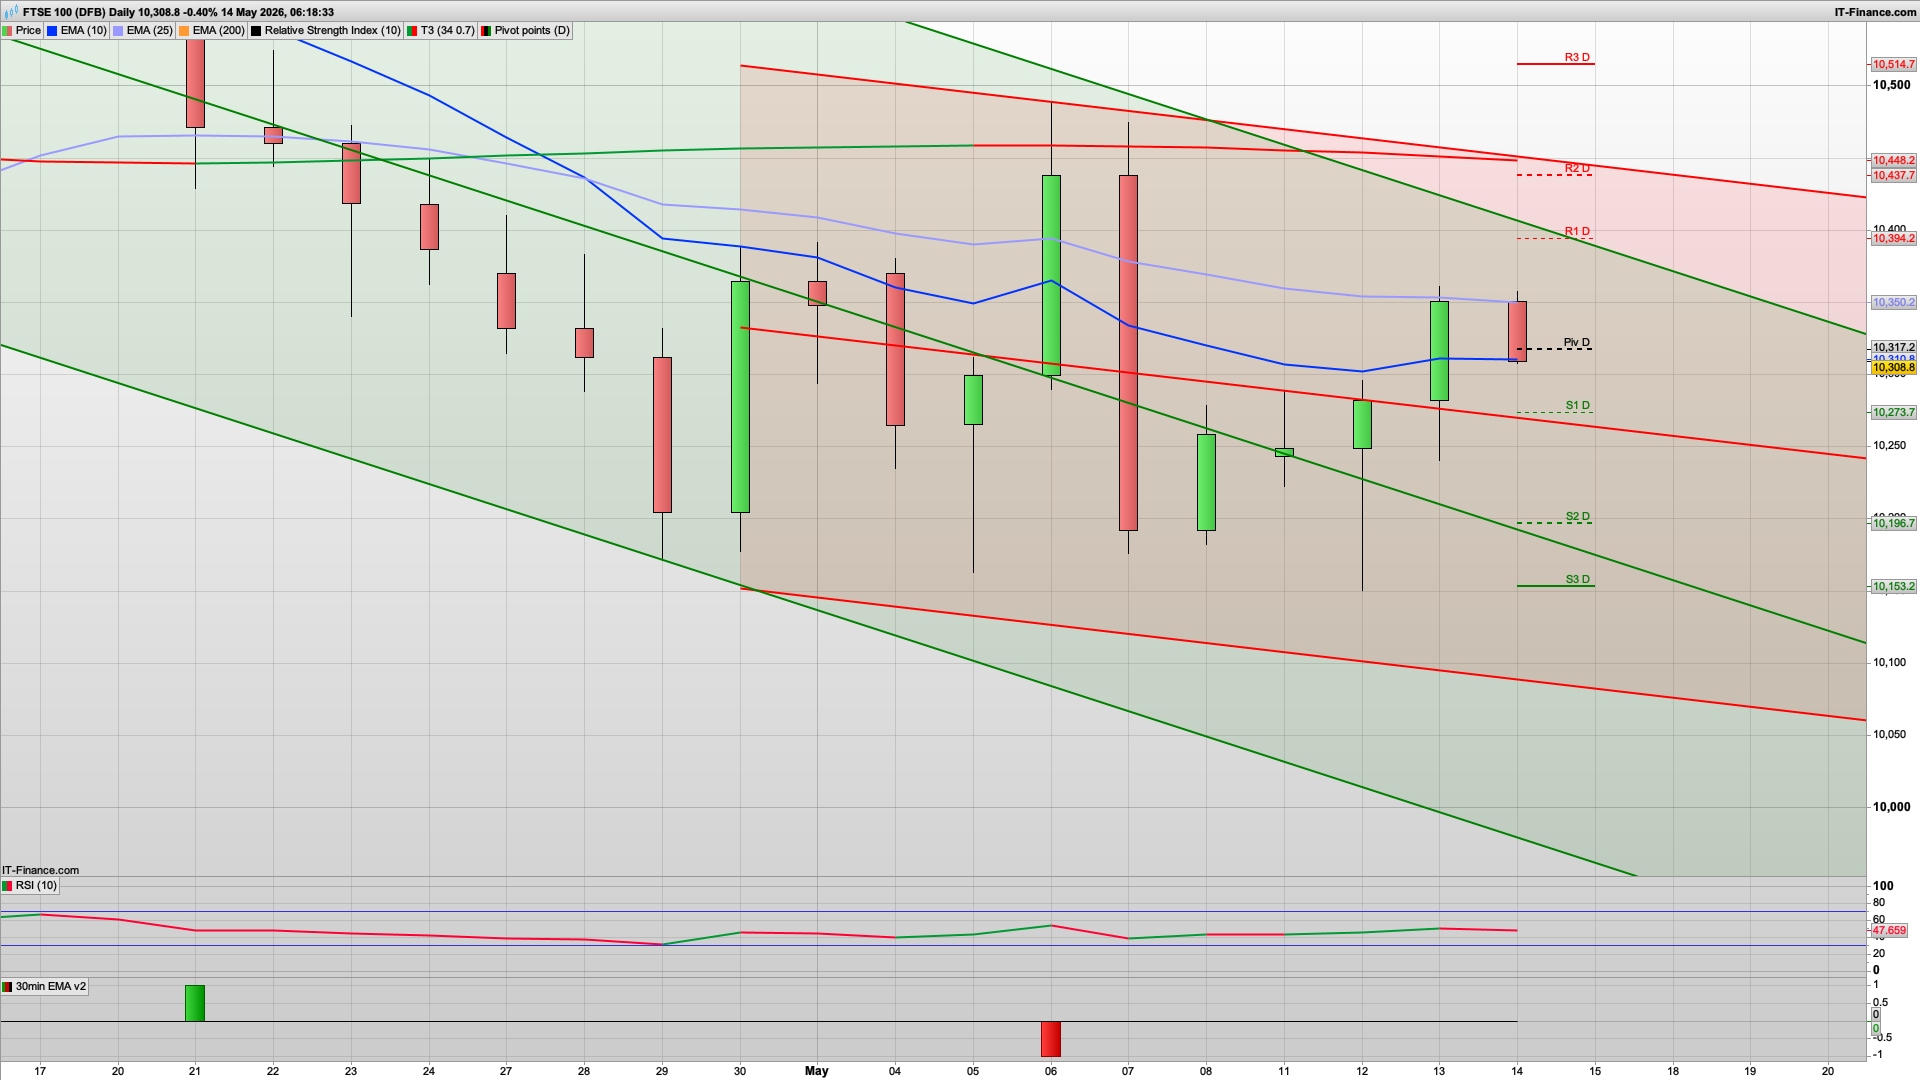
- Bias: Neutral / slightly bearish
- FTSE still trapped under falling trend resistance
- Recovery attempts continue failing near the pivot zone
- Relative weakness versus US indices remains obvious
- Key levels
- Resistance: 10,394 → 10,448 → 10,515
- Support: 10,274 → 10,197 → 10,153
- Trading view
- Favour short-term fade trades under 10,350
- Market needs a breakout above falling channel resistance to shift bullish
- Below 10,250 could bring another weak leg lower
- FTSE still looks corrective rather than trending.
DAX40
- Bias: Mild bearish / sell rallies
- Price continues drifting below the pivot and short-term resistance band
- Lower highs forming after rejection from the 25k spike
- Momentum flattening around EMA support with no strong recovery candle yet
- Key levels
- Resistance: 24,256 → 24,374 → 24,478
- Support: 24,075 → 23,881 → 23,777
- Trading view
- Preference remains to fade rallies into 24,300–24,400
- A break under 24,075 likely opens a move toward 23,900
- Only sustained trading back above 24,400 would improve structure
- DAX still looks weaker than US indices.
NASDAQ
- Bias: Bullish continuation
- Trend channel remains firmly intact
- Yesterday’s pullback held cleanly and buyers stepped back in
- Price sitting above pivot and trend midline support
- Key levels
- Resistance: 29,686 → 29,942 → 30,301
- Support: 29,323 → 29,070 → 28,753
- Trading view
- Buy-the-dip remains preferred
- Strong momentum structure still favours continuation higher
- Above 29,700 could trigger another momentum expansion leg
- NASDAQ remains the strongest market on your board.
S&P 500
- Bias: Bullish
- Healthy rising channel still intact
- Consecutive higher lows continue
- Price comfortably above pivot and trend support
- Key levels
- Resistance: 7,486 → 7,521 → 7,576
- Support: 7,395 → 7,358 → 7,304
- Trading view
- Bullish while above 7,395
- Pullbacks likely remain buyable
- Momentum slightly slower than NASDAQ but still constructive
- Trend remains steady and controlled.
GOLD
- Bias: Neutral / range trade
- Gold remains trapped around pivot and EMA cluster
- Momentum is compressing inside the rising channel
- No clear breakout confirmation yet
- Key levels
- Resistance: 4,728 → 4,756 → 4,785
- Support: 4,671 → 4,642 → 4,614
- Trading view
- Likely rotational/choppy trade again today
- Rejection near 4,730–4,760 favours shorts
- Bullish only if price can reclaim and hold above 4,760
- Gold still lacks directional conviction.
Best Opportunities Today
- Strongest Long Setups
- NASDAQ dip buys
- S&P continuation longs
- Strongest Short Setups
- DAX rallies into resistance
- FTSE failed rallies under trendline
- Choppy / Lower Conviction
- Gold
Market Theme Today
- The same broader pattern continues:
- US markets = leadership and momentum
- European indices = weaker and rotational
- Gold = waiting for catalyst
- Unless US futures break trend structure later in the session, the higher probability remains:
- buy US pullbacks
- fade European strength
- treat gold as range-bound rather than trending.
The bulls will be keen to defend any drop down to the 10300 area to keep the potential rise towards 10488 on the table, and with the daily pivot at 10318 and the 30m 200ema at 10290 they may well manage it. They will have the momentum from yesterday's climb on the S&P500 providing some tailwind, and a rise this morning towards the 10390 level may well play out. We have just had the GDP data out, showing a 0.6% rise in Q1 (Jan to Mar).
If the bears were to break below the 10290 level then another test of 10250 looks likely as we have the key fib here, along with the 2h coral (now green, showing uptrend) and 10265 for the Hull MA support on the 2h also. Below this then look for the 10196 S2 level but I am more inclined to go with the 10290 holding.Hopefully not famous last words there!
If the bulls were to break above the 10392 level and R1 then 10437 is R2, with that daily level at 10488 above this - seems a big ask for today but.....
We are also getting a slight uptick in the 10d Raff channel, with resistance at the top of that channel at 10446 and the 20d at 10408. We are still in the scenario of a bullish US and weaker DAX40 and FTSE100.
The S&P500 will be looking to build on yesterday's rise and 7440 is now Hull MA support, with the daily pivot just below at 7430. As such any dip down to this zone may well then see a bounce towards R1 at 7485 or higher.
Generally we may start to see a shift in sentiment for the FTSE100 and 10250 is looking key - the bulls really need to defend that....
Good luck today.
Interested in how to start trading the FTSE 100? Frequently Asked Questions on Spread betting
Recommended Broker for trading - MT4/5, web and mobile

IC Markets - offers market leading pricing and trading conditions by providing clients with True ECN Connectivity; this allows you to trade on institutional grade liquidity from the world’s leading investment banks, hedge funds and dark pool liquidity execution venues. Highly recommended!
Join my Membership for Trading Tips, Support and Resistance Levels with Live Trading
If you would like more detailed analysis for FTSE 100, DAX40, Gold and the S&P500, including the trades that I am looking to take myself, then please join my active members community.
Keep up to date with new website posts, free sign up below
