
Technical analysis for 18th May 2026
FTSE 100
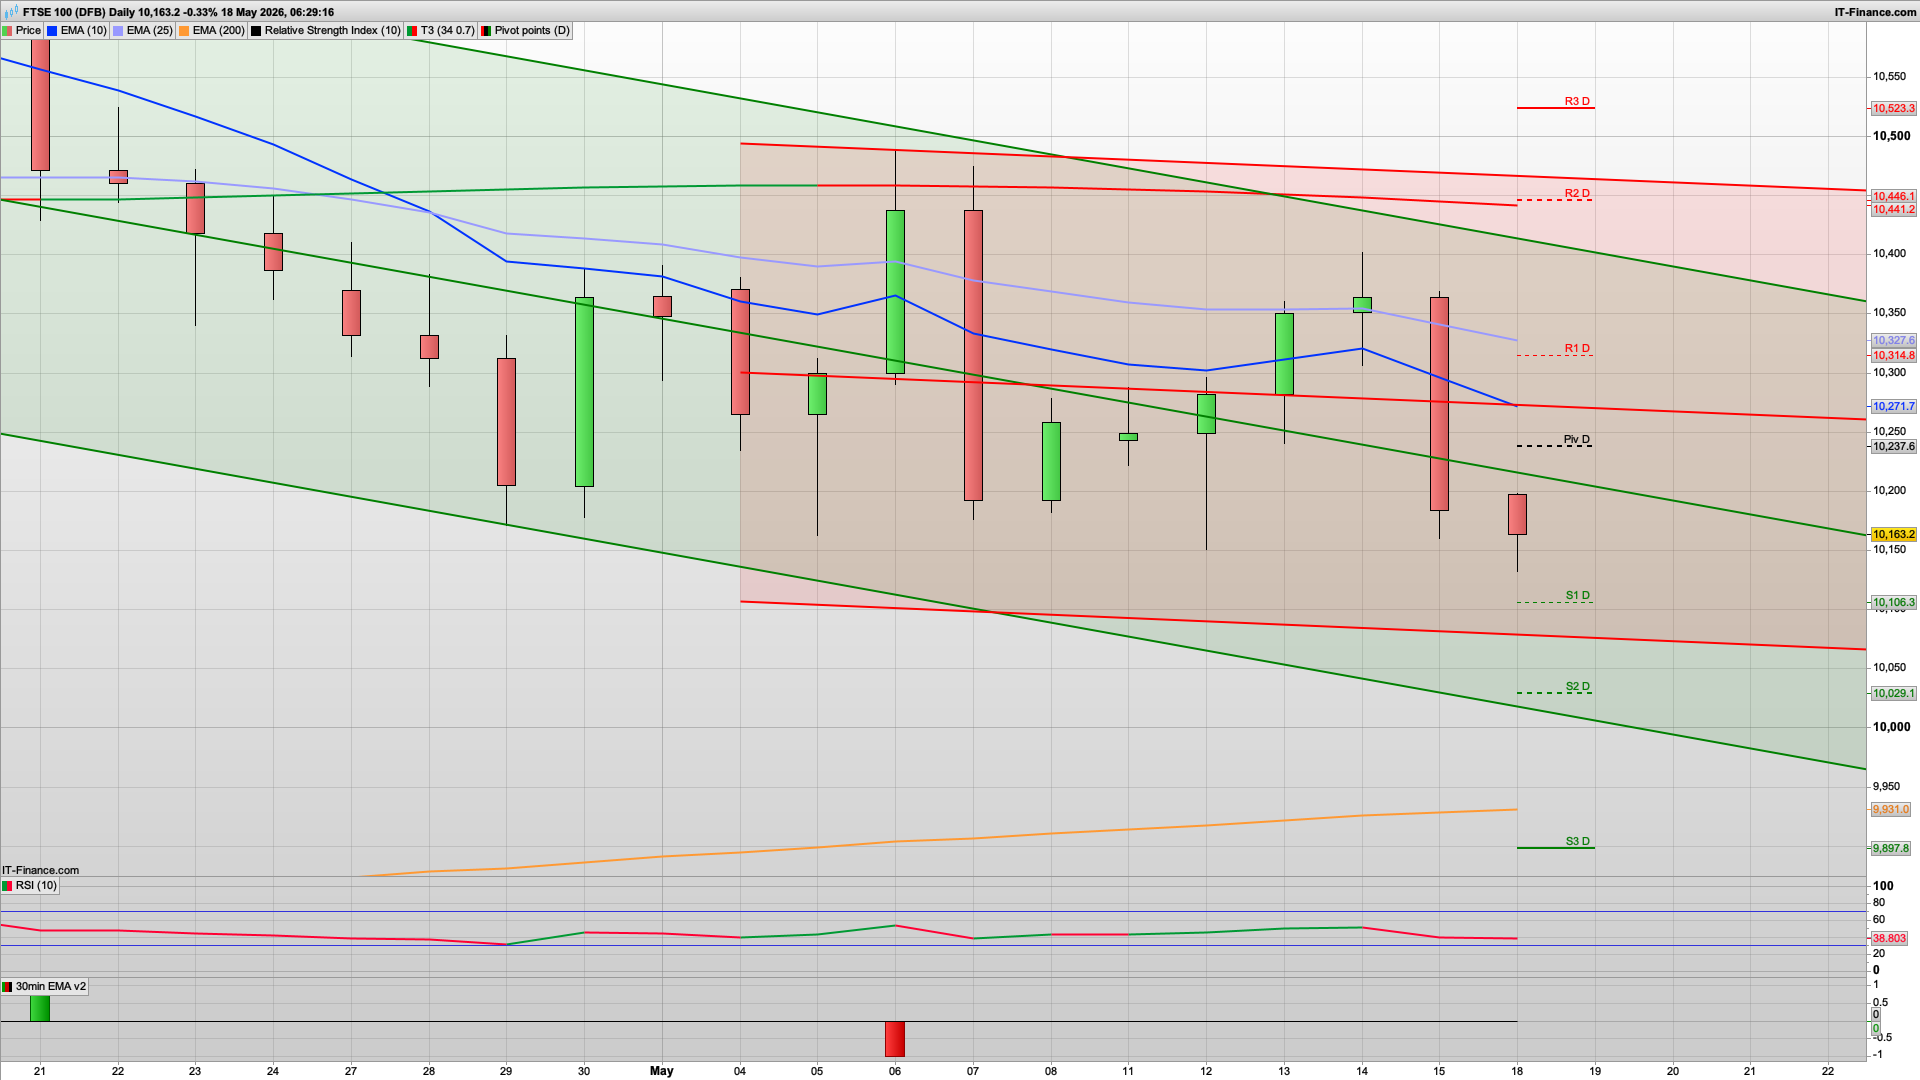
- Bias: Bearish
- Continuing lower within falling channel
- Failed recovery attempt and now back below EMA/pivot structure
- Relative weakness remains significant
- Key levels
- Resistance: 10,238 → 10,315 → 10,446
- Support: 10,106 → 10,029 → 9,897
- Trading view
- Favour selling rallies
- Below 10,150 risks acceleration toward 10,050–10,000
- Needs recovery above 10,250 to neutralise bearish pressure
- FTSE remains one of the weakest charts overall.
DAX40
- Bias: Strong bearish
- Clear downside continuation after Friday’s heavy sell candle
- Trading below pivot, below short EMA structure, and under channel resistance
- Momentum remains weak with RSI rolling lower
- Key levels
- Resistance: 24,001 → 24,196 → 24,552
- Support: 23,645 → 23,451 → 23,094
- Trading view
- Sell rallies remains the high-probability play
- Any recovery into 23,950–24,050 likely sold
- Break below 23,650 opens risk toward 23,450 quickly
- DAX40 is showing clear risk-off pressure.
NASDAQ
- Bias: Neutral to mildly bearish
- Friday produced a strong bearish rejection candle from upper channel resistance
- Today opening weak near S1 support
- Trend still bullish longer-term, but momentum cooling
- Key levels
- Resistance: 29,179 → 29,365 → 29,654
- Support: 28,890 → 28,704 → 28,415
- Trading view
- Likely corrective/choppy session
- Sellers still have short-term control below pivot
- However, strong dip buyers may appear near 28,700
- NASDAQ looks like consolidation/pullback rather than full trend reversal.
S&P 500
- Bias: Neutral-bearish short term
- Large bearish reversal candle after extended rally
- Now testing EMA support and lower trend channel
- Momentum has weakened materially versus last week
- Key levels
- Resistance: 7,422 → 7,458 → 7,520
- Support: 7,360 → 7,325 → 7,263
- Trading view
- Slight downside pressure early
- If 7,360 fails, deeper correction likely
- Reclaiming pivot would stabilise sentiment
- S&P weaker than before but still structurally healthier than Europe.
GOLD
- Bias: Bearish but oversold intraday
- Strong downside breakdown candle on Friday
- Trading below EMA cluster and below pivot
- However, market is now stretched short-term after aggressive selling
- Key levels
- Resistance: 4,575 → 4,636 → 4,750
- Support: 4,479 → 4,419 → 4,325
- Trading view
- Primary bias still bearish
- But expect volatile rebounds/intraday short covering
- Better risk/reward may come from fading rallies rather than chasing lows
- Gold still bearish structurally, but becoming crowded on the short side short-term.
Best Opportunities Today
- Best Shorts
- DAX rallies
- FTSE rallies
- Gold bounces
- More Cautious
- NASDAQ and S&P are entering pullback mode but still inside broader uptrends
Market Theme Today
The tone has shifted from:
- momentum buying to defensive/profit-taking
Current conditions suggest:
- weaker European equities
- softer US indices after exhaustion candles
- continued pressure on gold
- increased probability of volatile corrective trading rather than trend expansion.
We have another Monday that has gapped down, most noticeably on the S&P500 so we may well see another rise and dip play out as the bulls attempt to push it up this morning. The FTSE100 isn't quite as negative having mainly sold off on Friday, so may well put in a rise towards the daily pivot at the 10240 area. We also have the 30m 200ema here, so any rise to this area may well see the bears appear.
Whilst below the 10240 level I am favouring the bearish side, with the potential still existing for a drop down to the 10015 daily support area at some point and if we were to break the 10100 level today then it could happen sooner rather than later.
Above 10240 then look for a rise towards the 10315 level and a test of R1 and the key fib.
Generally today it's all looking a lot weaker and we are nearing the bottom of the 10d Raff channel as I write this at the 10075 level as well so should it weaken initially then look for some support at this area, though if the bears were to break 10100 then I can see it going lower!
Simple Game Plan
Below 10,240:
- favour shorts only.
Best opportunities:
- sell rallies,
- sell failed pivot reclaims,
- sell pullbacks after breakdowns.
Avoid:
- buying weak bounces,
- chasing large red candles after extended moves.
Interested in how to start trading the FTSE 100? Frequently Asked Questions on Spread betting
Recommended Broker for trading - MT4/5, web and mobile

IC Markets - offers market leading pricing and trading conditions by providing clients with True ECN Connectivity; this allows you to trade on institutional grade liquidity from the world’s leading investment banks, hedge funds and dark pool liquidity execution venues. Highly recommended!
Join my Membership for Trading Tips, Support and Resistance Levels with Live Trading
If you would like more detailed analysis for FTSE 100, DAX40, Gold and the S&P500, including the trades that I am looking to take myself, then please join my active members community.
Keep up to date with new website posts, free sign up below
