
Technical analysis for 19th February 2026
FTSE100 Bias
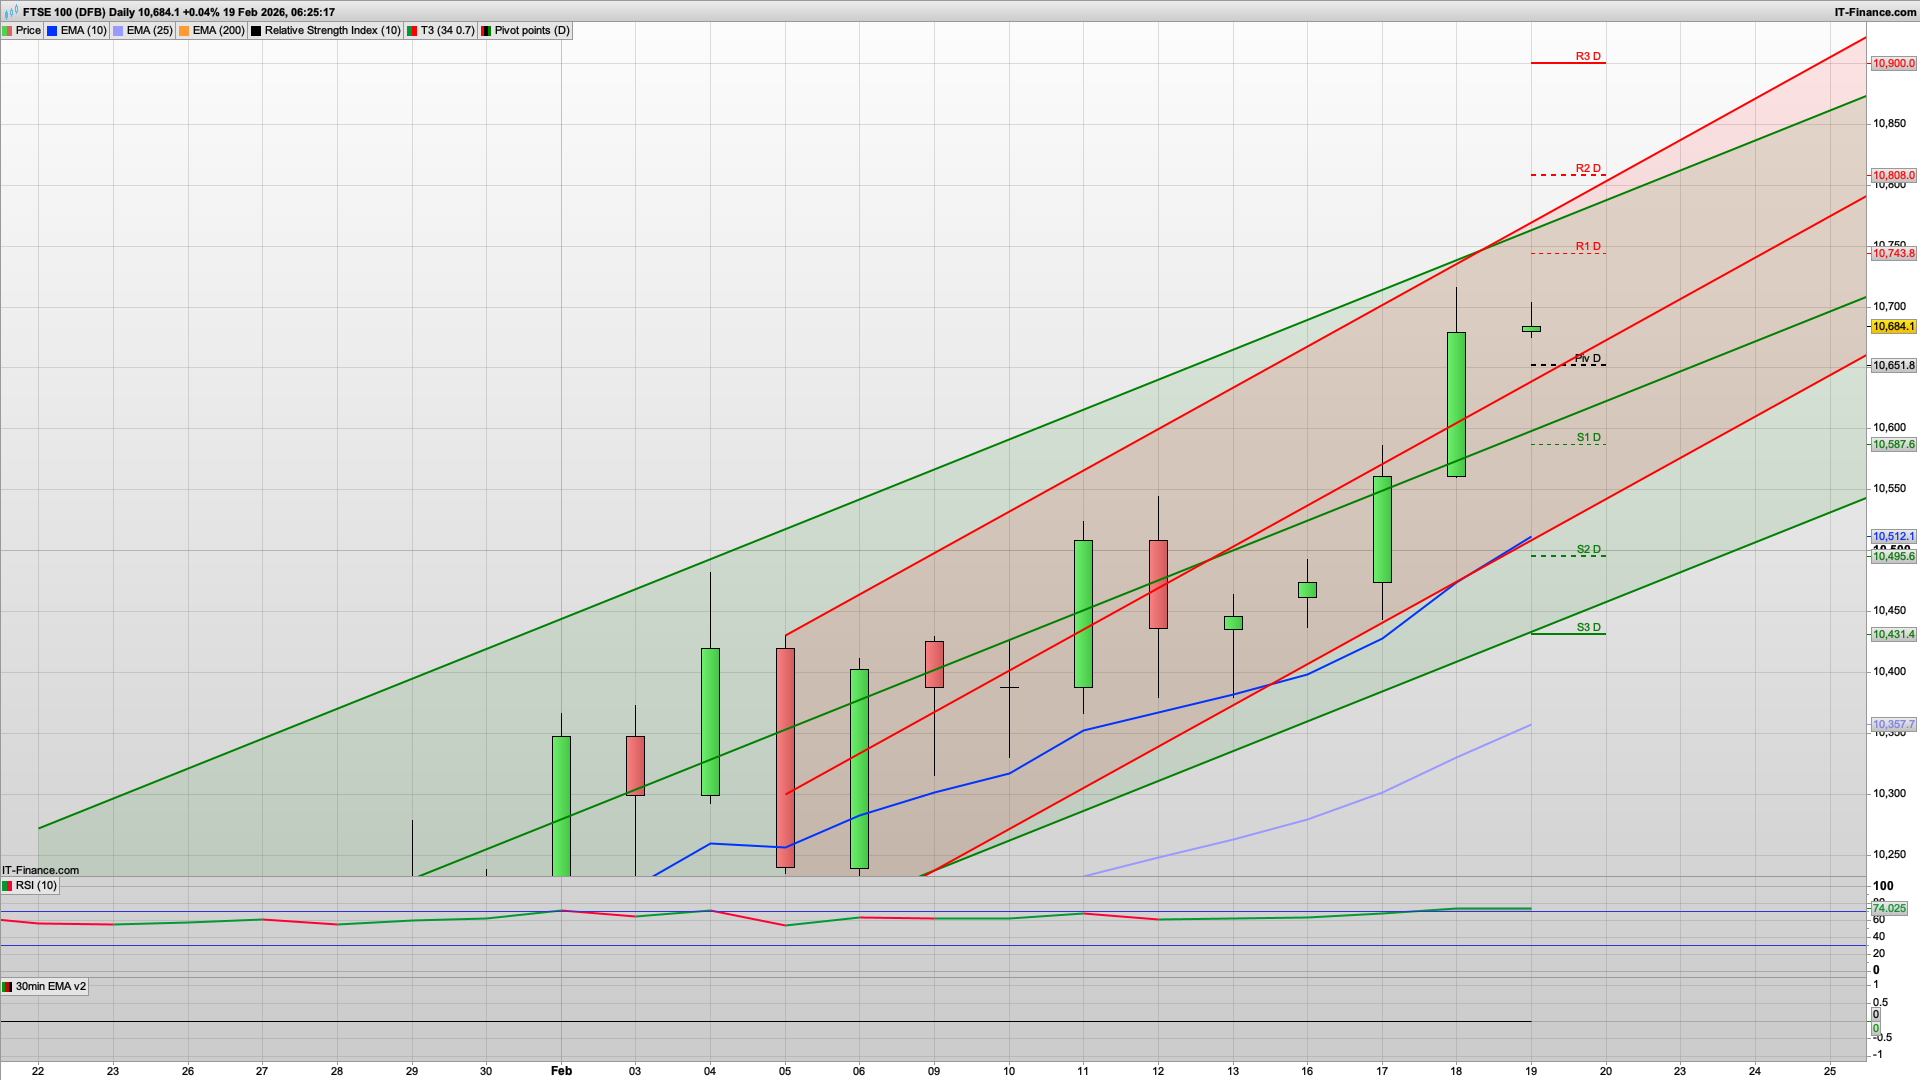
- Bias: Bullish (trend continuation)
- Grind higher toward 10,743 → 10,808, with dips being bought while price holds above 10,587.
- Clean stair-step higher inside rising channel
- Price holding above pivot and rising EMAs
- Strong bullish impulse candle with follow-through
- No meaningful rejection at highs yet
- Intraday plan
- Buy dips → 10,650 – 10,600
- Upside targets → 10,740 → 10,800 → 10,900 (R3 / channel top)
- Invalidation → loss of 10,580 and channel support
S&P500 Bias
- Bias: Bearish → Neutral (sell rallies below falling structure)
- Structure still lower highs inside descending channel
- Trading around pivot but under falling EMAs
- Recent bounce = corrective, not a confirmed trend change
- Resistance stacked overhead (EMA + R1 zone)
- Intraday plan
- Sell rallies → 6,900 – 6,940
- Downside targets → 6,845 → 6,800 → 6,740
- Flip to bullish only if → acceptance above 7,000
DAX40 Bias
- Bias: Bullish (buy dips while above pivot / channel support)
- Strong push back into the upper half of the rising channel
- Holding above the daily pivot
- Price above 10/25 EMA cluster → trend intact
- Momentum shift after the prior bearish candle = buyers in control
- Intraday plan
- Buy pullbacks → 25,180 – 25,050
- Upside targets → 25,365 → 25,500 → 25,680 (R3 / channel high)
- Invalidation → sustained acceptance below 25,000
Well that certainly got bullish yesterday as the hope for rate cuts manifested itself as expected. That saw the bulls manage to get the FTSE100 to the 10700 level and brings 11000 into sight! That said there is some strong daily resistance at the 10890 level and it will be interesting see if (a) it gets there and (b) what it does if so. The daily Raff channels continue to head up and the DAX40 Raffs have also joined the bullish party as well. The weaker market is ironically the US with the daily EMAs on the S&P and NASDAQ still bearish, and declining Raff channels on both of them.
Initially today I am thinking that we will see a rise towards the 10743 R1 and key fib level before a drop back to the 10651 daily pivot, and possibly the 2h Hull MA support at 10630. If we see that level then a long here is worth a go for another attempt at the 10700 level and possibly higher. The FTSE100 is certainly still looking pretty bullish - also helped with the rising oil price underpinning Shell and BP which are key components of the FTSE100.
Meanwhile, US v Iran is simmering away and the rhetoric is getting more bullish (along with the massing of more hardware) so we will see how that pans out over the next few days.
If the bears were to break below the 10630 level today then I am thinking that we could slide as far as the 30m 200ema at 10555 if S1 at 10587 were to break. That said the bulls will be keen to defend the 10600 round number.
Generally today then look for an initial rise across the board again with the DAX40 and S&P500 both looking for a rise towards the 25370 and 6909 areas respectively.
Good luck today.
Interested in how to start trading the FTSE 100? Frequently Asked Questions on Spread betting
Recommended Broker for trading - MT4/5, web and mobile

IC Markets - offers market leading pricing and trading conditions by providing clients with True ECN Connectivity; this allows you to trade on institutional grade liquidity from the world’s leading investment banks, hedge funds and dark pool liquidity execution venues. Highly recommended!
Join my Membership for Trading Tips, Support and Resistance Levels with Live Trading
If you would like more detailed analysis for FTSE 100, DAX40, Gold and the S&P500, including the trades that I am looking to take myself, then please join my active members community.
Keep up to date with new website posts, free sign up below
