

31st October 2018
Happy Halloween!
Here we are at the end of a roller coaster month that saw a bit of a recovery yesterday as the FTSE 100 managed to rise above the 7000 and hold there. The S&P 500 remains 8% below its all time high set in September though. The question is if 6850 is the low for the FTSE 100 for the time being and we see a rise back towards 7220+. There is resistance looming at 7131 though that the bulls will need to break first.
A promised extension to the Government’s help-to-buy scheme left house builders dominating the FTSE 100 risers board as investors digested the implications of Monday’s unusually late Budget for the companies’ revenues. The FTSE 100 edged up 9.53 points to close at 7,035.85.
U.S. stocks ended a tumultuous day sharply higher, with all major averages rising at least 1.4 percent as volatility continues to grip equity markets during earnings season. Treasuries fell and the dollar rose. The S&P 500 Index twice erased gains that topped 1 percent before finally securing a rebound in the final hour of trading. All 11 main groups rose, with consumer and commodity shares pacing gains. The average flirted with a correction earlier Tuesday and is still on track for its worst month of the bull market. Facebook edged higher in after-hours trading following its earnings report.
Asian stock markets were largely higher on the last day of what is shaping up as the worst month for global stocks in more than six years. Treasury yields pushed higher and the dollar edged up.
FTSE 100 Trading Signals, Forecast and Prediction
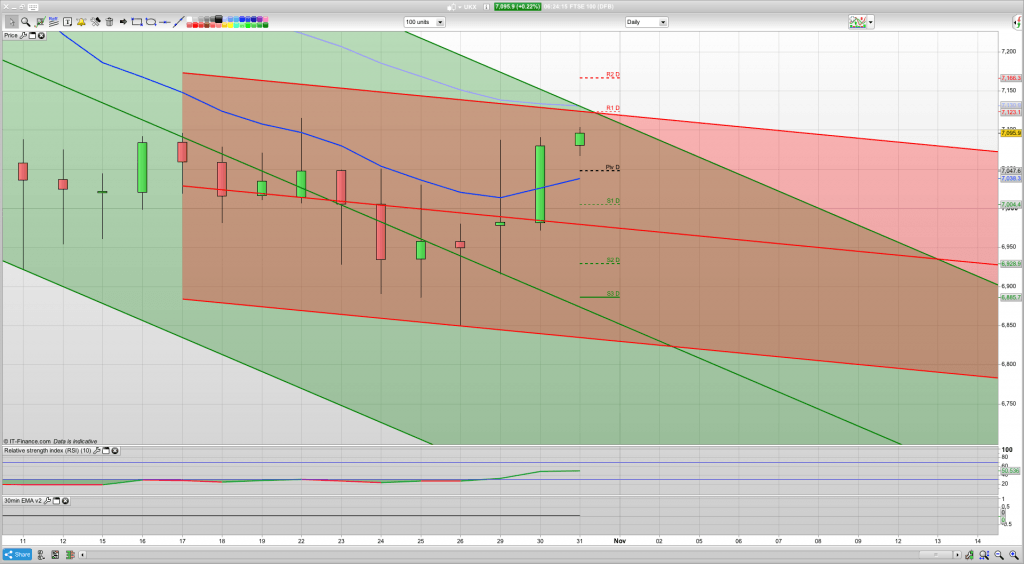
Last day of the month and I am thinking that we might finally see a test of the 25ema on the daily chart, that is currently at 7131. Its been a long time coming and in an ideal world the price would test this line fairly soon after the 10ema has crossed it. When it takes so long its possibly not as strong as it might have been. However, we also have both the Raff resistance lines at this area and R1 at 7123 so I think if we get a rise to this area today then we might well see a dip down to test the previous resistance now support at 7058.
That level is probably worth a long as we have the daily pivot at 7047 and yesterdays close at 7035. We also have a green rising coral on the 3min chart with support at 7063.
Membership
If you would like more detailed analysis for FTSE 100, DAX, Gold and S&P, including the trades that I am looking to take myself, then please join my active members community.
Results
I keep a record of all the trades communicated to members via the morning email trade plan and those alerted live. See the results here.
What you get
- Daily Analysis pre market open (sent around 7am each day) for FTSE, DAX, Gold and S&P.
- Daily email pre market includes my trading plan for the day including ORDER levels, with stops and targets/limits
- Telegram Chat room and webinar group membership for discussion and realtime trade updates