
Good morning. What appeared to be a positive day at the start soon unwound into a negative close. The main culprit was the prices of crude oil and metals which slipped worryingly during the day and pulled down oil and commodity shares. The main causes being lack of oil supply ceiling, a strong dollar and China economy concerns. After hours the market has stabilised with 6200 being a key support level which will possibly hold. However, there was weak data overnight as China’s exports fell for a fifth month and a slump in imports extended to a record 13 months, suggesting six interest-rate cuts and expedited fiscal spending are failing to boost growth. Inflation data on Wednesday is forecast to show producer price deflation deepened in November.
US & Asia Overnight from Bloomberg
Asian stocks fell ahead of China trade data after oil tumbled to a six-year low, weighing on energy producers and sending BHP Billiton Ltd. to its lowest in 10 years.
The MSCI Asia Pacific Index lost 0.3 percent to 131.79 as of 9:01 a.m. in Tokyo, with energy and material companies leading declines among the measure’s 10 industry groups. The gauge is on course to drop 4.4 percent this year, its first back-to-back annual losses since 2002, as a 24 percent collapse in the Bloomberg Commodity Index in 2015 weighs on resource producers and Chinese economic growth decelerates. American crude sank past $38 a barrel to its lowest level since 2009 after OPEC abandoned its strategy of limiting production.
“Market focus at the moment is the potential deflationary effects of lower oil prices, and the signaling that aggregate demand is weak,” said Michael McCarthy, chief market strategist at CMC Markets Asia Pacific Ltd. in Sydney. “The regional news is the release of China trade data. These are the numbers that smacked the market in August, and any further weakening could bring panic.”
Chinese exports for November probably fell 5 percent from a year earlier, according to the median estimate of a Bloomberg survey before a report due Tuesday. That compares with a 6.9 percent decrease the previous month.
Japan’s Topix index fluctuated after revised data showed gross domestic product rose an annualized 1 percent in the third quarter, beating estimates for a 0.2 percent gain. The previous reading showed a 0.8 percent decline, which had indicated the nation slipped back into recession.
Australia Slides
Australia’s S&P/ASX 200 Index dropped 1.1 percent. BHP Billiton, the world’s largest mining company, lost 5.1 percent, heading for its lowest close since 2005, after iron ore sank below $40 a metric ton on rising low-cost supply. Rio Tinto Group slipped 2.4 percent.
New Zealand’s S&P/NZX 50 Index retreated 0.1 percent, while South Korea’s Kospi index rose 0.2 percent.
Futures on the Hang Seng Index fell 0.7 percent in most recent trading, while contracts on the FTSE China A50 Index slipped 0.1 percent. The Shanghai Composite Index added 0.3 percent on Monday, rising for the fifth time in six days, as health-care, technology and consumer-discretionary companies rallied, outweighing declines for brokerages after Citic Securities Co. said it has been unable to contact two executives.
Futures on the Standard & Poor’s 500 Index fell 0.1 percent. The underlying equity measure lost 0.7 percent on Monday, trimming an earlier drop of as much as 1.2 percent, after jumping 2.1 percent on Friday. Traders are pricing in a 78 percent chance the Federal Reserve will raise interest rates at its meeting next week. [Bloomberg]
FTSE Outlook and Prediction
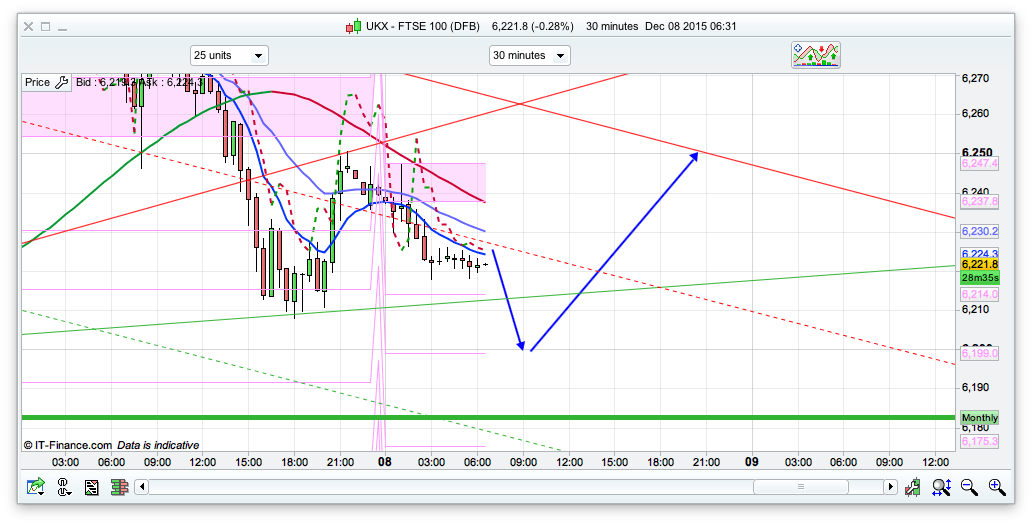
Todays pivot is 6247 and I think there might be a bit of initial resistance there, as we have dropped off that level overnight. It looks a bit bearish to start with with that weaker Chinese news, dropping the overnight rise back to yesterdays closing level. There is a cluster of supports around the 6200 area so we might get an initial dip to this area before a bounce, though all the moving averages I am watching on all the timeframes are pretty negative at the moment. The bulls need to break and hold above 6226 first thing to enable any sort of push higher, though the daily chart has the 6303 level fro the 25ema as the next hurdle for them to jump. Santa might have to be strong this year if we are going to get a rally towards the end of the month. I have gone for the first long at the 6200 area as we have the 20day Bianca at 6206, as well as S1 and the 10min channel there.