

22nd January 2018
Want to discuss things with other traders – please visit the free forum here for todays discussion
The US government shutdown has entered its third day today as the Senate fails to end the stalemate. The disruption intensifies efforts by Republicans and Democrats to blame one another for the deadlock and may harden the determination of lawmakers to gain leverage from the moment.
In other news this week we have further earnings and also have the Davos summit, so we may here some news out of that this week. Markets might just tread water a bit while the talking happens.
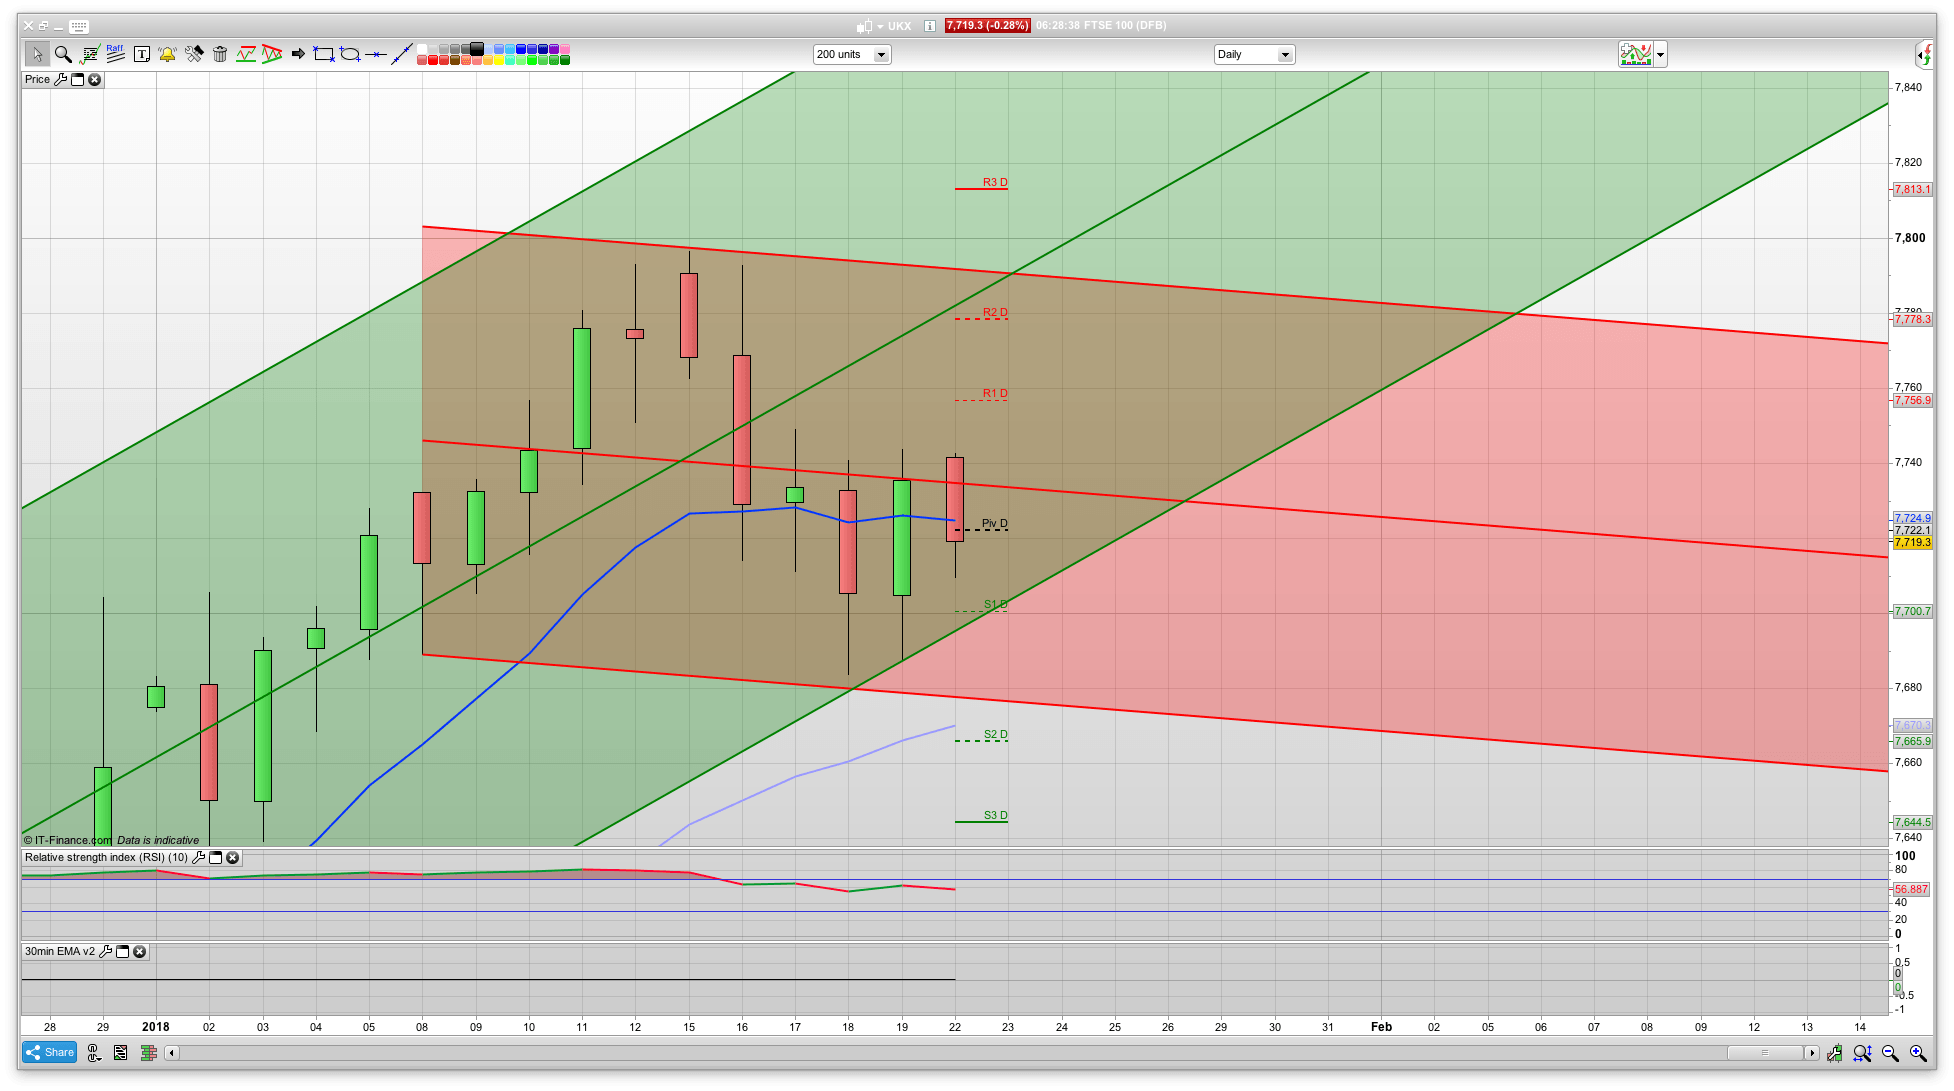
Last week the FTSE dipped down to the the 7683 support level, but bounced well. The bullish trend therefore remains in tact and there is currently 2 hour support at 7700. Last weeks lower support of 7640 wasn’t tested and remains the line in the sand as a break of this changes the picture short term. Below the 7700 level the daily chart shows support at 7670, and again that is a decent looking swing long entry area.
Fib resistance is at 7776 with R2 at 7778 so watching this area for a reaction today. A break of this will likely test 7793 again, with 7813 above that (R3).
FTSE Outlook and Prediction
Cable (GBP/USD) continued to move higher towards the 140 level last week, and looks set to continue rising. Support is down at 136/13650 so a pullback to that area looks good for longs. In turn, that will effect the FTSE100 so we may see a rise and dip scenario over the course of the week (inverse to the cable move).
Fridays resistance level of 7740 was tested last night and has seen a drop from there, but with Friday’s decent rise and 7683 holding, the 2 hour chart is now bullish with 7700 showing as support.
Initially today I am thinking that we will see a rise to the 7740 level again, with possibly a push slightly higher to the 7750 level. R1 and a fib level are at 7757 so if this holds as initial resistance a dip down to the 7700 support area then looks viable. We are still in a decent, fairly strong bullish trend so buying the dips is still preferable – 7700 and 7670 representing decent entries.
Membership
Want more detailed analysis for FTSE 100, DAX, Gold and S&P? Then please join our active members community.
What you get
- Daily Analysis pre market open (sent around 7am each day) for FTSE, DAX, Gold and S&P.
- Daily email pre market includes my trading plan for the day including ORDER levels, with stops and targets/limits
- Telegram Chat room and webinar group membership for discussion and realtime trade updates