
8th October 2018
Asian markets slipped during Mondays session, as China’s central bank cut the amount of cash lenders must hold as reserves for the fourth time this year, as policy makers seek to shore up the faltering domestic economy amid a worsening trade war. The People’s Bank of China lowered the required reserve ratio for some lenders by 1 percentage point, effective from Oct. 15, according to a statement on its website Sunday. The cut will release a total of 1.2 trillion yuan ($175 billion). The central bank has shifted to looser monetary policies this year as the combined effects of Beijing’s financial clean up and the trade conflict with the U.S. threaten the economic expansion. Meanwhile, China’s foreign-currency holdings fell in September, as heightened trade tensions with the U.S. fueled concerns of capital outflow and further yuan depreciation.
Lat week saw soaring US Treasury yields to multi-year highs, overall solid macroeconomic data and hawkish comments from Fed chair Powell who stated rates are still some distance from neutral. Although Friday’s non-farm payrolls came in lower than forecasted, US unemployment hit a new multi-decade low and average hourly earnings fell in-line with consensus. Markets sold off during a bearish week, though last thing Friday did see a bit of a kick up as the FTSE 100 neared the 7290 support area. It has remained above the round number support of 7300 going into this week, with the 2 hour chart showing resistance at the 7392 level to start with.
FTSE 100 Trading Signals, Forecast and Prediction
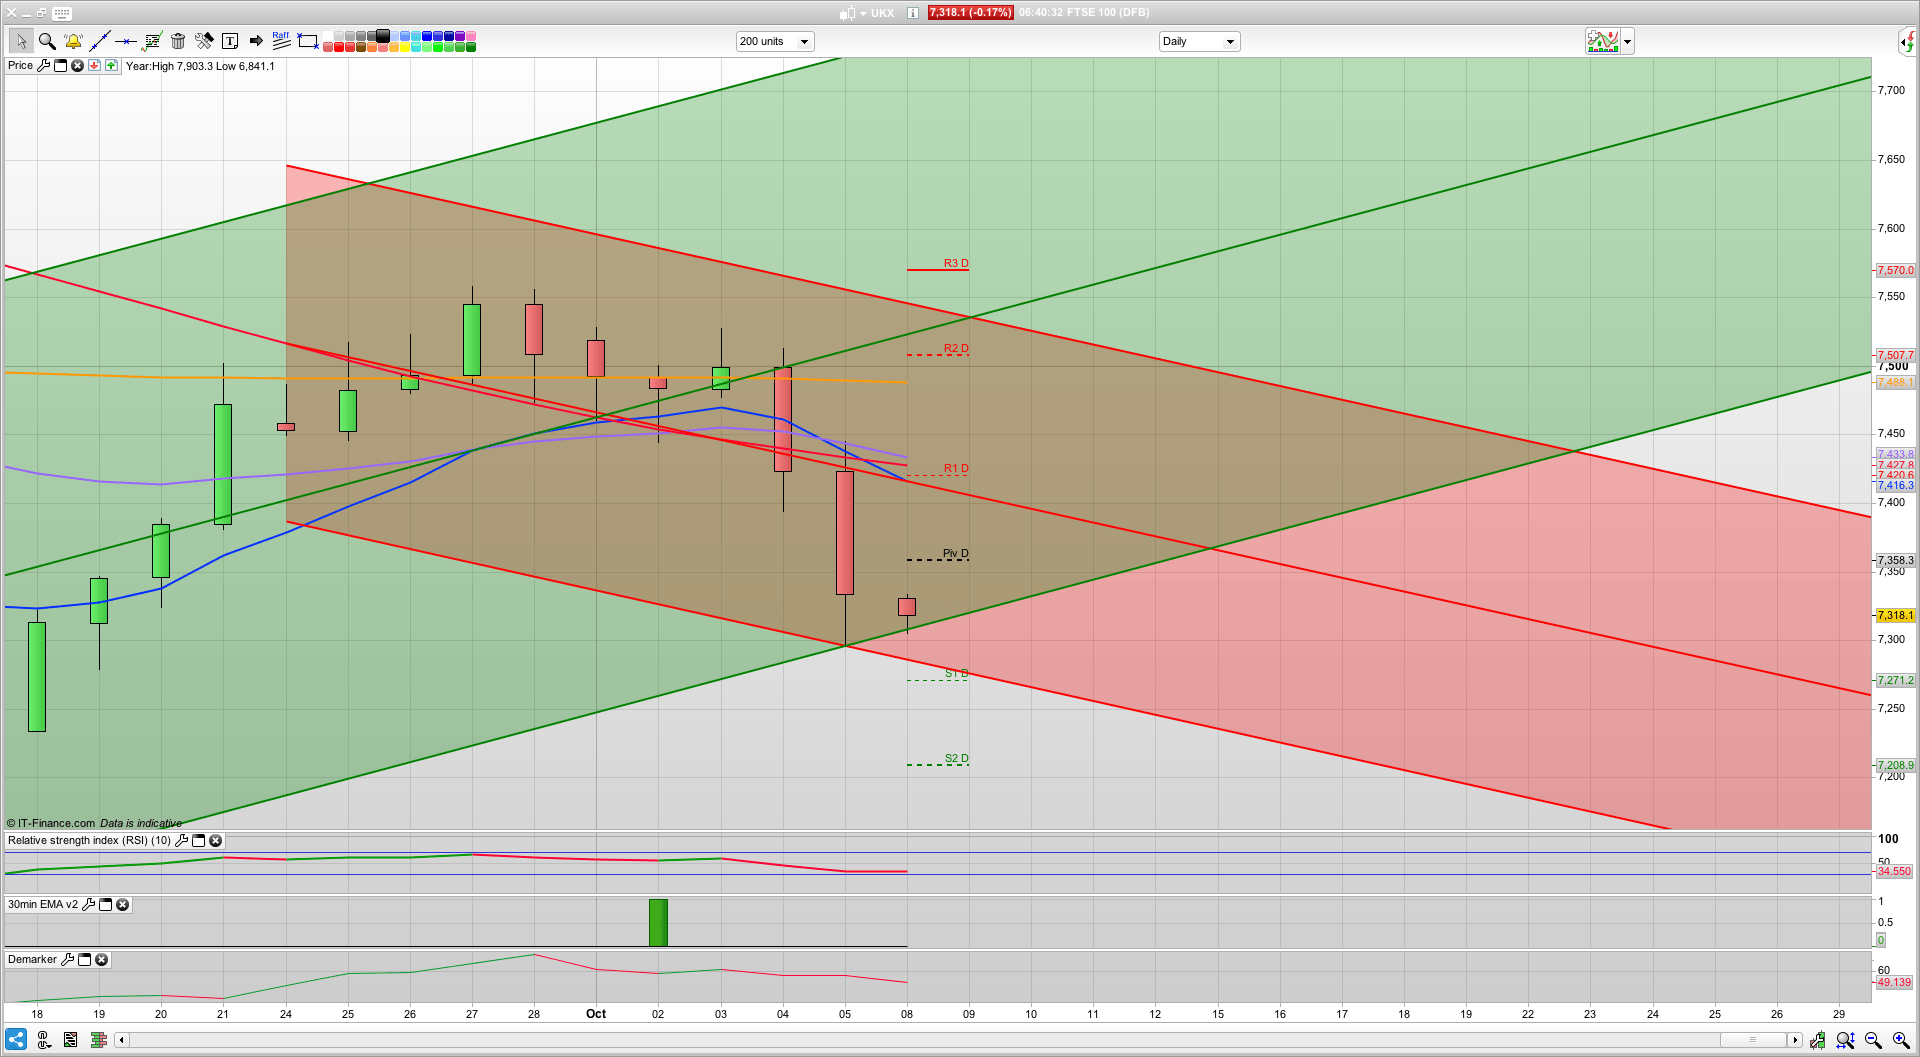
For today I am looking at initial support at the 7295 area where we have Friday evening’s lows and also a key fib level after Fridays sell off. If this holds, and its a very tentative long there as Australia sold off quite strongly during Monday’s session, and the US has Columbus Day today, then we should see a rise towards the daily pivot at the 7348 level. Above this I am still watching the resistance on the 2 hour chart which is showing at 7392 to start with but is moving down quite fast. As such any rise up towards the 7390 area is worth a short.
On the daily chart, we are at the bottom of the 20 day Raff channel, and the 10 day is just below at 7283, with a daily RSI of just 34 at the moment. The fear/greed indicator is on Fear as well, so a possible bounce could be looming. Below the 7290 level we have daily support at 7250 so worth keeping an eye on this area.
Membership
If you would like more detailed analysis for FTSE 100, DAX, Gold and S&P, including the trades that I am looking to take myself, then please join my active members community.
Results
I keep a record of all the trades communicated to members via the morning email trade plan and those alerted live. See the results here.
What you get
- Daily Analysis pre market open (sent around 7am each day) for FTSE, DAX, Gold and S&P.
- Daily email pre market includes my trading plan for the day including ORDER levels, with stops and targets/limits
- Telegram Chat room and webinar group membership for discussion and realtime trade updates