
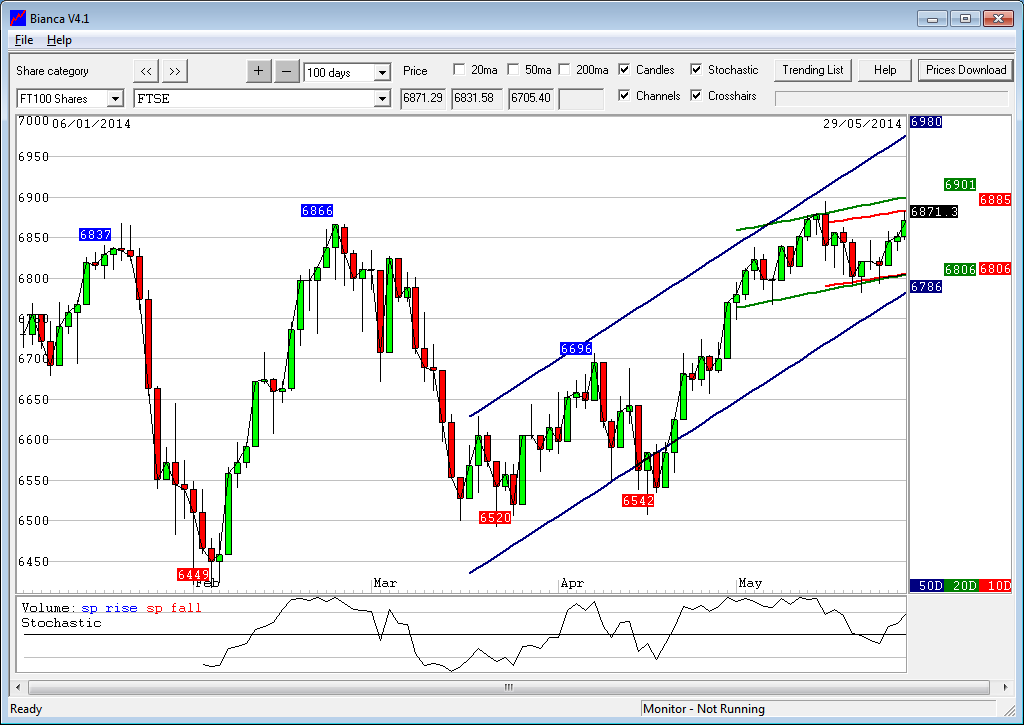
Good morning. We got a bounce off the pivot yesterday first thing up to the 6875 resistance area, where it trod water all day! The S&P was the lively one, following the plan with the support at 1910, rising to the 1919 (finally!). What happens now though as the news flow took a slight downward turn yesterday with US GDP contracting in the first quarter.
The US seems caught in a Japan-style trap, endlessly masking the effect by stealing a little extra growth from the future with artificial stimulus. Biond yields have also been falling at the fastest rate since the recession scare 2 years ago. The slowdown comes as a key indicator of the US money supply flashes slowdown warnings, though the picture remains murky after extreme weather conditions over the winter.
Output fell at an annual rate of 1pc, led by a 7.5pc fall in business spending following the expiry of tax concessions. The tax rules had brought forward investment in 2012 and 2013, leading to a cliff-edge drop this year.
“We think there is more to this than just weather. Our leading indicators were already weakening late last year,” said Lakshman Achuthan, from the Economic Cycle Research Institute (ECRI). [from here]
At these levels it will be worth being slightly cautious for bulls – gold has held its 1255 support, S&P has reached that 1920 high point, FTSE has struggled to go higher than the 6880 so far (still 6925 possible though), Dax nearly at 10000, yet a few warning signs flashing.
Asia Overnight from Bloomberg
Asia’s benchmark stock index headed for its biggest monthly gain since September, with equities today swinging between gains and losses as material producers declined and information-technology companies rose.
The MSCI Asia Pacific Index (MXAP) lost 0.1 percent to 142.01 as of 11:36 a.m. in Hong Kong, reversing a gain of 0.3 percent. The gauge is poised for a third weekly advance, bringing its monthly gain to 3.4 percent. The value of global equities climbed to a record $63.9 trillion as the Standard & Poor’s 500 Index reached all-time highs this week.
“There’s room for a correction as valuations are looking stretched following this month’s rally,” Desmond Chua, a strategist at CMC Markets in Singapore, said by phone. “While Japanese inflation was encouraging, this reduces the potential for further monetary easing.”
The S&P 500 traded at 16.3 times estimated earnings yesterday compared with 13.1 times for the Asia-Pacific measure.
Regional Gauges
Japan’s Topix index dropped 0.2 percent, erasing gains of as much as 0.4 percent. The country’s core inflation rate accelerated to 3.2 percent in April, the biggest jump in 23 years, data released by the statistics bureau today showed. That was faster than the 3.1 percent estimate by economists surveyed by Bloomberg. The jobless rate held at 3.6 percent last month, in line with expectations, while industrial production missed forecasts, according to a separate report.
South Korea’s Kospi index declined 0.3 percent. The nation’s industrial output increased 2.4 percent in April from a year earlier. That compares with the median estimate of 3.1 percent by 18 economists surveyed by Bloomberg.
Australia’s S&P/ASX 200 Index (AS51) and New Zealand’s NZX 50 Index both lost 0.2 percent, while Singapore’s Straits Times Index dropped 0.3 percent. China’s Shanghai Composite Index was little changed and Taiwan’s Taiex index slipped 0.1 percent. Hong Kong’s Hang Seng Index added 0.3 percent and the Hang Seng China Enterprises Index of mainland stocks traded in the city advanced 0.5 percent.
The Asia-Pacific gauge rebounded 9.2 percent from this year’s low in February through yesterday amid optimism the U.S. economy can withstand a reduction in stimulus and that Chinese policy makers will step in to bolster slowing growth.
USA
Futures on the Standard & Poor’s 500 Index slipped 0.1 percent today. The U.S. equity benchmark index climbed 0.5 percent to a fresh record yesterday after Tyson Foods Inc. offered to buy Hillshire Brands Co.
U.S. gross domestic product shrank an annualized 1 percent in the first quarter, worse than the most pessimistic forecast in a Bloomberg survey of economists, revised Commerce Department figures showed yesterday in Washington. With much of the contraction due to less inventory building that economists say can’t last, some are boosting second-quarter growth forecasts, with Morgan Stanley projecting a 4.2 percent expansion.
Fewer Americans than forecast filed applications for unemployment benefits last week, figures from the Labor Department showed yesterday.
“The global economy is recovering gradually, boosting sentiment on equities,” Steven Milch, Sydney-based chief economist at Suncorp Group Ltd., which manages about $18.6 billion in assets, said by phone. “The underlying picture in the U.S. and Japan is improving.”
FTSE Outlook
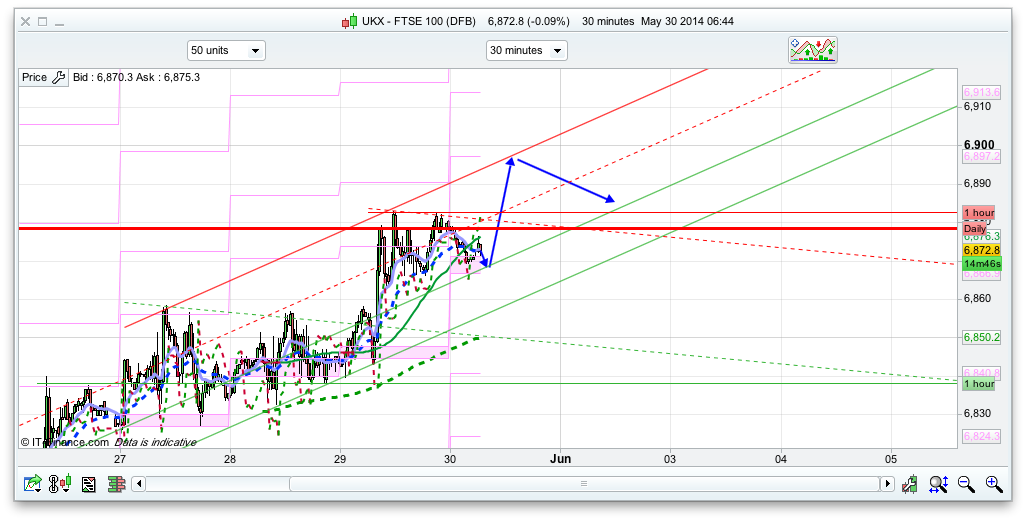
Its a shame no one rings a bell at the top or the bottom of the market and we can all pile in. That said we are around the top of both the 10 and 20 day Bianca channels, the S&P has hit the 1919 level and gold is possibly bottoming at 1255. There is still an outside chance that the FTSE will push to its all time highs at 6925ish – a good place to short if it does so, and we have 6867 as support today, being the daily pivot. Below that there is the bottom of that rising 30 minute channel at 6857. Will we get a dip and rise again, before profit taking later on as its Friday – and also the end of the month?
I am feeling more bearish now – have shorted the S&P at the 1919 level as I had to really after mentioning it (stop 1923) – and think that the FTSE might just have one last go to break 6900 and stop out a few snorters that have piled in already. Whether that means the S&P will pop a little bit higher as well remains to be seen.
I have put a short order in for the all time highs, but the Bianca channels are saying that it most likely won’t reach that high today. As such we have a fairly narrow band to play with – support at 6867 and resistance at 6900, and I have plotted the arrows as such for the most likely play today. However if it does break 6900 and pop to that 6925 level then thats good for shorts.
Ravi, posted my reply on yesterday’s post
Thanks for the insight, I’m currently shorted too, but feels incredibly risky so I have gone for a very small PPP.
Support at ≈6855 but lift-off rather feeble so far. US and Germany relatively firm.
And if an Europe QE comes in place next week ?
I’m still out.
My be case off buy the rumour sell the news… Beside think a far bit ECB meeting next week has been priced into markets.
Will 6863 hold? anyone long here?
ECB QE . . . € will bomb, €zone markets will fly, Draghi will speak gobbledegook, and the FTSE . . . ?
You bet Jim. You just need to look what happen to US in past years.
Exactly PMS! The banks can’t be trusted to do the right thing with manna from heaven (QE 🙂 ).
Might see that 6900 early next week. Next week IMO will be the turning point, with a lot of data out, indicators levelling off(wishful thinking).
Loss of 6k atm with shorts on S&P 1900, DAX 9890 avge.
‘Sell in May and go away…to come back cleaned’ should be the new phrase lol
I’m afraid these few points offer no consolation ahwab. The link below is to a weekly chart of the S&P 500, showing a year’s worth of history. The general trend is strongly positive. However, the first LinReg (black) shows just a slightly rising trend between late December last and mid-April of this year. My main point is that in the last 7 weeks the index has bucked that 5-month low-growth trend and begun to pick up momentum again. The second LinReg (red) is a function of that development. I suspect that the short-term extrapolation of the latter LinReg is not too far off the mark, showing ≈1950 by the end of June. Building momentum should develop the emerging upswings in MACD and PRICEGRAD, my growth indicator. 🙁 Obviously, this is just my current perspective.
http://i1348.photobucket.com/albums/p736/jmca01/US500DFB_zpsf430060a.png
Despite my strategy, I was looking for a short in the 1935-1940, with stop at b/e in the 1st opportunity. I think we are going for a small correction in the next days.
The price has been trading outside the bollinger bands in spx
There is a protrend line in that area on daily/weekly chart
hehehe, what a sell off in ftse close.
came up quickly 😉
Another close below 6875 in the weekly. Momentum still weak in ftse. Pausing or something worse
heheheh, impressive those yankees
I only regret the uptrend breakout started in end of last week. I was in and sold Friday, because of weekend elections and Ukraine and also the bank holiday
It was a great POMO week 🙂
Anyone still long ftse and Dow on Monday?
1940 is my short level for now, Let’s see the pace…