
Technical analysis for FTSE 100 for 26th July 2024
The FTSE 100 ended higher on Thursday after upbeat earnings from Unilever and British American Tobacco helped counter losses in precious metal miners on the back of a slump in gold prices.
The blue-chip FTSE 100 index closed up 0.4%, rebounding from a three-month low hit earlier in the session.
Meanwhile, U.S. small cap stocks rallied but tech stocks came under pressure after data showed the U.S. economy grew faster than expected in the second quarter, helped by solid consumer spending and business investment. Following the data, gold prices hit a two-week low.
An element of calm has returned to markets as a wild week winds down, with European and U.S. stock futures pointing overall higher on Friday following the frenetic selling of the previous two days.
Asia-Pacific equity benchmarks were overall flat to higher, with some weakness in Chinese markets contrasting with robust gains for Australia and South Korea. Taiwan was an unhappy exception, though, with a 3.4% slide - a delayed reaction to the global tech rout after markets there were shuttered the previous two days by a typhoon.
There's little in the way of economic data or earnings reports to shake up markets in European hours, but the U.S. PCE deflators - a favourite inflation measure of the Fed's - could inject some additional volatility before the weekend.
Key developments that could influence markets on Friday:
- US PCE price index (June)
- US earnings include 3M, Bristol Myers Squibb, Colgate Palmolive
U.S. stock futures pointed higher, with S&P 500 futures rising 0.36% and Nasdaq futures advancing 0.45%.
Oil prices rose slightly as the stronger-than-expected U.S. economic data raised expectations for increased crude demand from the world's largest energy consumer. Brent crude futures for September rose 7 cents to $82.44 a barrel. U.S. West Texas Intermediate crude for September increased 4 cents to $78.32 per barrel.
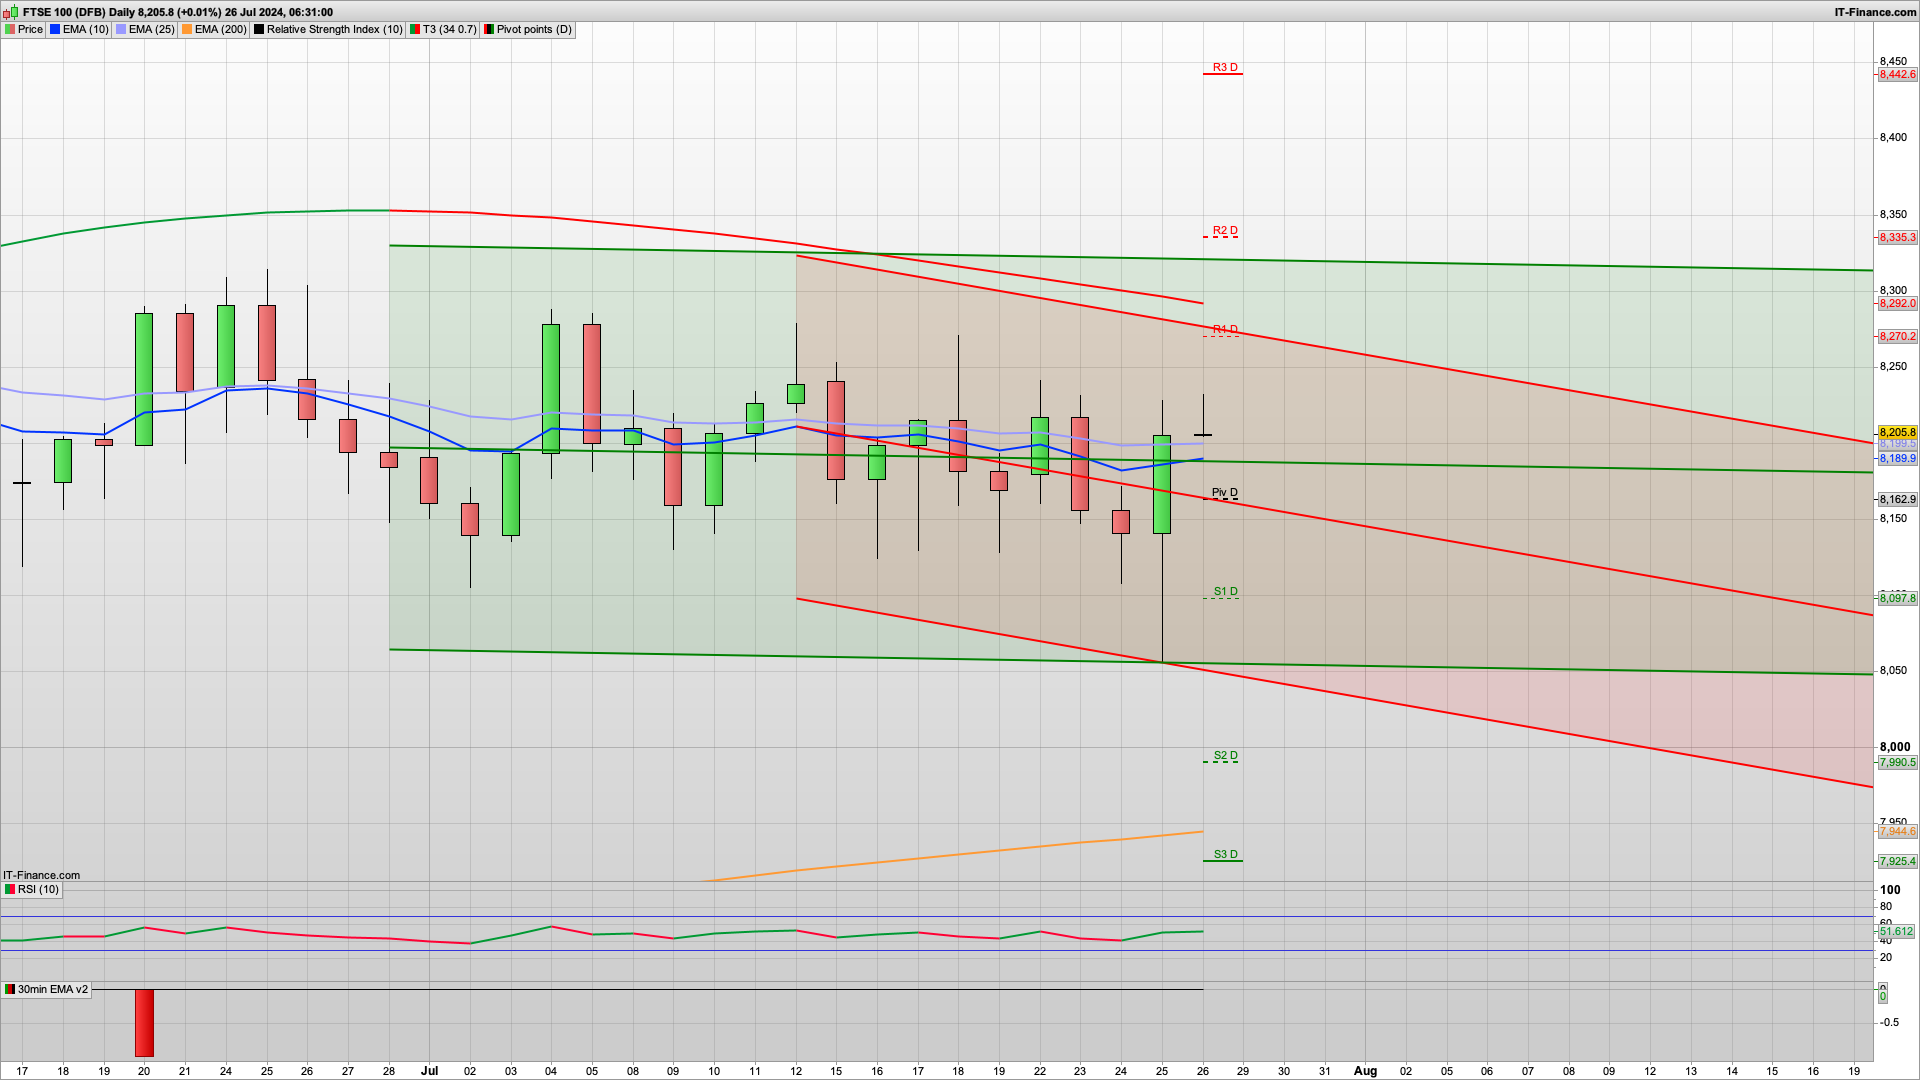
FTSE 100 technical analysis for today, 26th July 2024
Good to see the bounce from the 8060 level yesterday in what may yet prove to be a stunning bear trap.... If the bulls can defend today and we don't drop below the 8163 pivot then we should be on for a decent end to the month.
We also have the green 30m coral for support to start with at 8185 and the 30m 200ema at 8173 so a few other supports in this general area to start with. The bulls will be keen to defend any drop and build on that bounce yesterday. 8200 being the round number may even see a defence to start with as well...
However, a break of 8160 and 8112 key fib level is next up, and a slide like that will fuel the bears. They will ultimately be for looking for a move down towards the 8000 level however the rumours of a rate cut persist and are getting louder, possibly as early as next week!
If the bulls do defend the 8170 area then we should get a decent climb today and initially I am looking for the 8270 area where we have R1, and 8277 for the top of the 10d Raff channel.
A stall here ahead of the weekend would then make sense as well and see some profit taking.
Looking ahead, highlights include German Import Prices, Spanish Retail Sales, Italian Business Manufacturing Confidence, US PCE, ECB SCE, Earnings from Holcim, Capgemini, Air Liquide, Mercedes-Benz, Wacker Chemie, BASF, NatWest, 3M, Aon & Bristol-Myers.
Have a nice weekend.
Interested in how to start trading the FTSE 100? Frequently Asked Questions on Spread betting
Recommended Broker for FTSE 100 trading and how to start trading using support and resistance

IC Markets - offers market leading pricing and trading conditions by providing clients with True ECN Connectivity; this allows you to trade on institutional grade liquidity from the world’s leading investment banks, hedge funds and dark pool liquidity execution venues. Highly recommended!
Membership, Trading Tips, Support and Resistance Levels with Live Trading
If you would like more detailed analysis for FTSE 100, DAX, Gold and S&P, including the trades that I am looking to take myself, then please join my active members community.
What you get
- Daily Analysis pre market open (sent around 7am each day) for FTSE 100, DAX40, Gold and S&P 500.
- Daily email pre market includes my trading plan for the day including ORDER levels, with stops and targets/limits
- Telegram live trading room and group membership for discussion and realtime trade updates
Keep up to date with new content, free sign up below with just your email address
