
FTSE100 Analysis | Signals | Forecast | Prediction | FTSE 100 Outlook | Trading help
FTSE100 live outlook prediction analysis for 13th October 2022
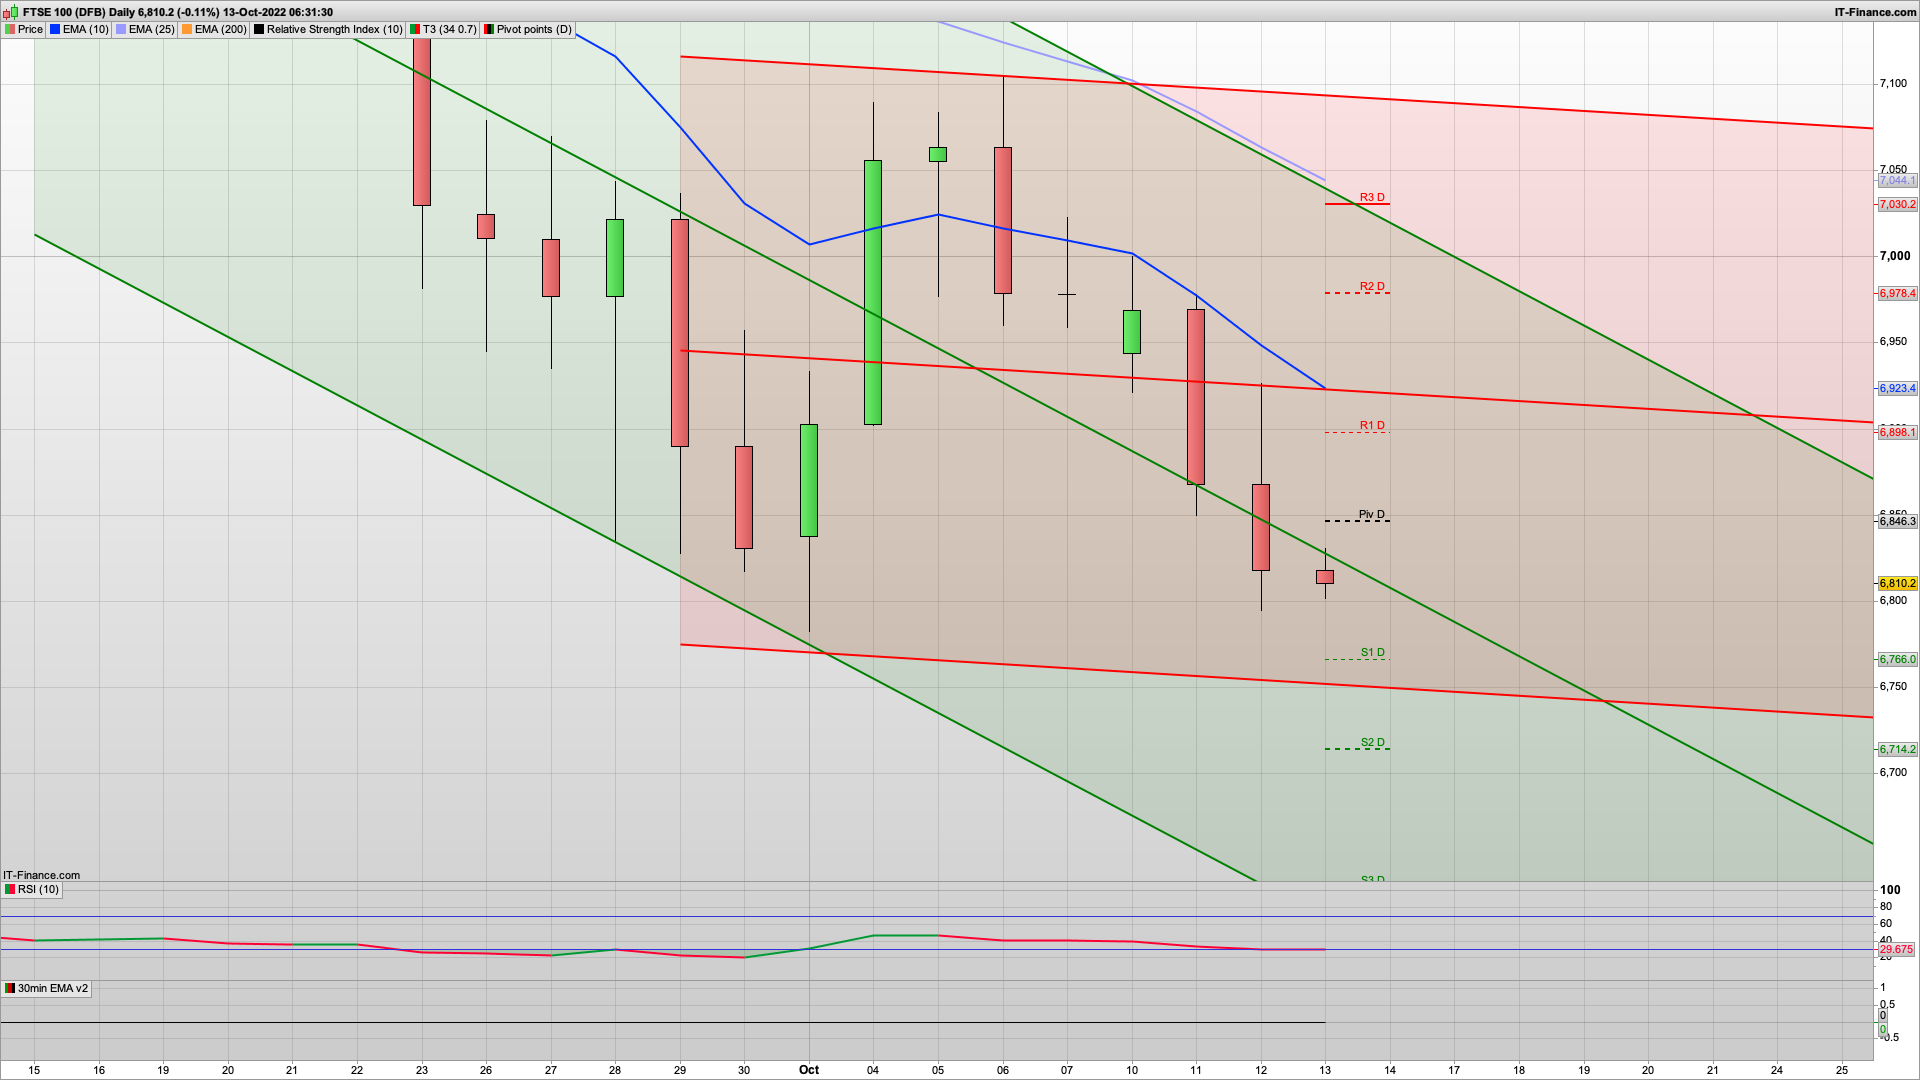
Today’s the day that they have been talking about all week and we finally get the US inflation data out at 1330 – so be cautious today as it might well be extra choppy. Initially this morning we are on the daily support at the 6800 area (6797 is the exact support level (most recent in hours low) so we could see a rise and dip play out today as once again, buy the rumour sell the news pans out.
A close below the 6800 level is going to make the FTSE look quite bearish. Personally I think we are probably past peak inflation now – energy costs have dropped back, demand has been tempered for products and services etc. I mentioned a while ago that I was just starting to see more “deals” being offered on products via email etc, and that has increased more over the past month. Why offer discount and deals if you cant make/sell stuff fast enough?
If we do get an initial rise then I am looking for the bulls to reach the 6900 area or just below, though that is quite a rise ahead of the CPI. We have a cluster of resistance levels here that would be good to test, namely the key fib, R1, 2h coral, and the 200ema 30m. Interestingly, the 2h charts for the Dax and S&P are both bullish, so they could help to pull the FTSE up a bit, and we also got a rise and dip on the ASX200 today.
Prior to 6900 we have the daily pivot at 6846 which could see a stutter, so bear that in mind. Above 6900, and this might be a bit too optimistic, then 6920 once again is the line in the sand (support now resistance) and then 6978 for R2. I don’t think we will get that high but you never know.
Support wise, below the 6797 level then 6782 out of hours on the 3rd October is next up (we also have the key fib at 6791 today), and then S1 at 6766. Below that then the bottom of the 10d Raff channel is at 6750 if it gets really bearish – though we could see a reaction there so keep it in mind.
S&P500
As mentioned the 2h chart is now weakly bullish, and has support at the 3555 area for today. The Hull MA line has held a few tests overnight so we could well see a spring up off that in hours later. It all depends on CPI really, The YoY forecast is 8.1% (versus 8.3% previously) but maybe it will come in below that. Core inflation rate YoY is forecast at 6.5% versus 6.3% previously.
A rise towards the 3612 R1 level would be good, and that would also test the 2h coral (still red) and get a reaction there. Buy the rumour sell the news! The short term trend is still down of course but the bulls will need to step up, just need a catalyst! A short squeeze coming? Support wise then S1 aligns with that 2h Hull MA, and then S2 at 3543 below that. Above 3612 then 3642 R2 is the next area of note.
Good luck today – don’t forget CPI at 1330 and stay nimble!
Recommended Broker

IC Markets – offers market leading pricing and trading conditions by providing clients with True ECN Connectivity; this allows you to trade on institutional grade liquidity from the world’s leading investment banks, hedge funds and dark pool liquidity execution venues. Highly recommended!
Membership and Live Trading
If you would like more detailed analysis for FTSE100, DAX, Gold and S&P, including the trades that I am looking to take myself, then please join my active members community.
What you get
- Daily Analysis pre market open (sent around 7am each day) for FTSE100, DAX40, Gold and S&P500.
- Daily email pre market includes my trading plan for the day including ORDER levels, with stops and targets/limits
- Telegram live trading room and webinar group membership for discussion and realtime trade updates
Keep up to date with new content, free sign up below with just your email address