
Technical analysis for 21st May 2026
FTSE 100
- Bias: Neutral-bullish
- Finally breaking upward from compression/range structure
- Holding above EMA cluster
- Momentum improving but still less aggressive than US markets
- Key levels
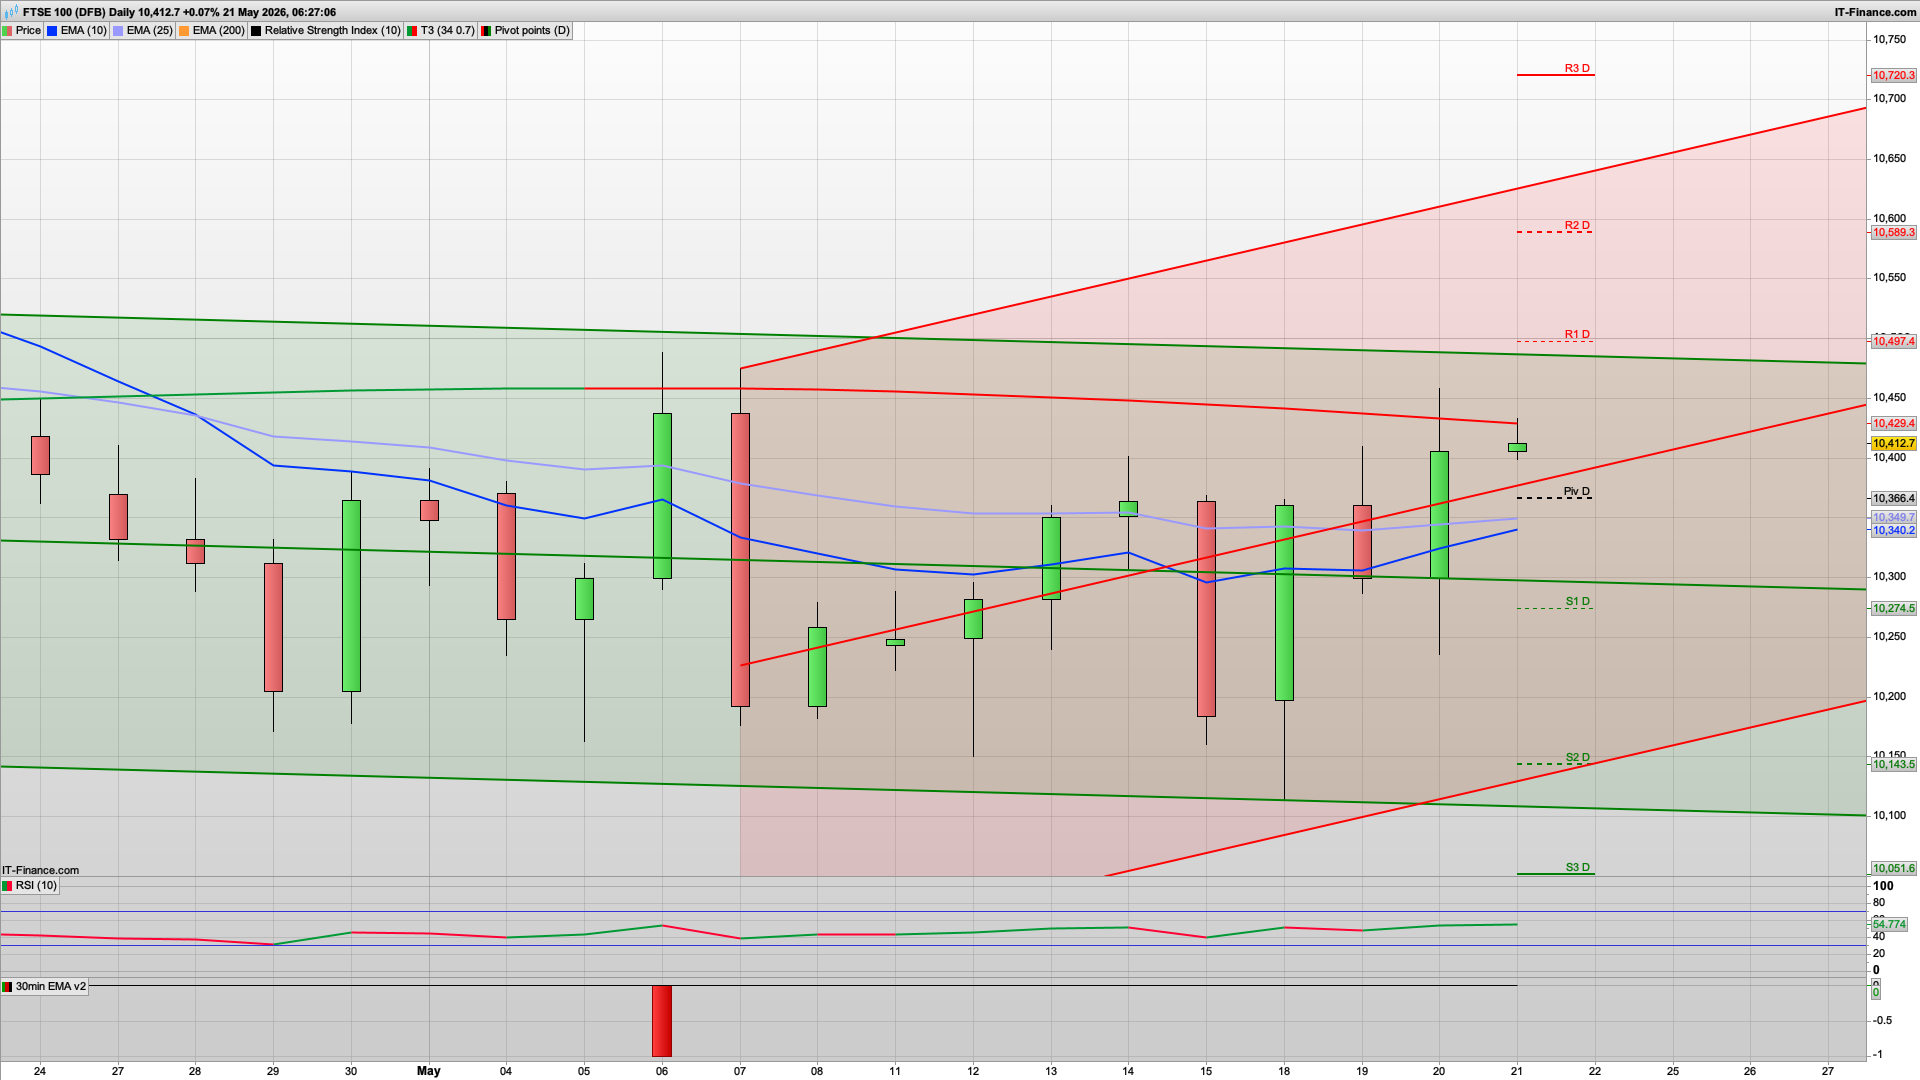
- Resistance: 10,429 → 10,497 → 10,589
- Support: 10,366 → 10,274 → 10,143
- Trading view
- Slight bullish bias while above 10,360
- Needs strong break above 10,430 for momentum expansion
- Otherwise likely slower grind higher
- FTSE improving materially versus previous sessions.
DAX40
- Bias: Bullish
- Strong continuation after reclaiming EMA support
- Price holding comfortably above pivot and trend support
- RSI improving and momentum remains constructive
- Key levels
- Resistance: 25,003 → 25,318 → 25,739
- Support: 24,582 → 24,268 → 23,905
- Trading view
- Buy pullbacks while above 24,580
- Holding above 24,700 keeps upside pressure active
- A break toward 25k looks increasingly likely
- DAX currently strongest European setup.
NASDAQ
- Bias: Bullish
- Strong recovery candle from rising channel support
- Back above pivot and holding trend structure
- EMA continuing to slope upward
- Key levels
- Resistance: 29,459 → 29,647 → 29,989
- Support: 29,117 → 28,929 → 28,587
- Trading view
- Prefer buying dips
- Above 29,100 keeps momentum firmly bullish
- Potential continuation toward 29,500–30,000 zone
- NASDAQ remains market leader overall.
S&P 500
- Bias: Bullish
- Trend support respected again
- Higher lows remain intact
- Momentum improving after recent consolidation
- Key levels
- Resistance: 7,460 → 7,496 → 7,556
- Support: 7,401 → 7,365 → 7,305
- Trading view
- Buy dips into EMA/trendline support
- Above 7,400 maintains bullish continuation
- Room for extension toward 7,500+
- Cleanest trend structure among the indices.
GOLD
- Bias: Bearish
- Still trapped inside descending channel
- Trading below both EMAs and pivot
- Weak bounce attempts continue failing
- Key levels
- Resistance: 4,571 → 4,614 → 4,676
- Support: 4,478 → 4,416 → 4,379
- Trading view
- Sell rallies remains preferred
- Below 4,500 keeps downside pressure dominant
- Only sustained reclaim above 4,600 would neutralise bias
- Gold remains the clearest short setup today.
Best Opportunities Today
- Best Longs
- NASDAQ dips above 29,100
- S&P continuation longs above 7,400
- DAX momentum toward 25k
- Best Shorts
- Gold failed rallies into EMA resistance
Market Tone Today
- The overall tone has shifted more decisively risk-on:
- US indices remain in strong uptrends
- DAX now joining the bullish momentum
- FTSE lagging but improving
- Gold continues weakening as capital rotates into equities
- Today favours:
- buying pullbacks in indices
- avoiding aggressive index shorts unless key supports fail
- continuing to fade gold strength until structure changes.
Following yesterday's bounce from the 10250 level it's looking more bullish rolling into today with the bulls looking to break above the 10500 level. This is the key resistance level above the 10450 level so look for a bearish move off this, otherwise a break will likely lead to continued upside. The 10d Raff channel is now heading upwards again, but with the top of the 20d channel at 10490 the bulls will certainly need a bit of a tailwind to break above this.
Initially we have support from the daily pivot at the 10366 level and a steadily rising Hull MA on the 2h, currently at 10345 which also favours buying the dip. We have PMI data at 09:30 so expect a bit of volatility around this but it could lead to a bullish reaction.
If the bears were to break below the 10350 level then 10302 is the key fib, with 10274 S1 below that. That said I am more inclined to go with the daily pivot holding so keep a close eye on this level at 10366.
If the bulls were to break above the 10500 level then 10589 is R2, which feels rather optimistic but you never know....
The S&P500 and NASDAQ are both looking strong and favouring buying the dip still, while the DAX40 also needs to defend any test of the daily pivot initially, at the 24582 level.
Interested in how to start trading the FTSE 100? Frequently Asked Questions on Spread betting
Recommended Broker for trading - MT4/5, web and mobile

IC Markets - offers market leading pricing and trading conditions by providing clients with True ECN Connectivity; this allows you to trade on institutional grade liquidity from the world’s leading investment banks, hedge funds and dark pool liquidity execution venues. Highly recommended!
Join my Membership for Trading Tips, Support and Resistance Levels with Live Trading
If you would like more detailed analysis for FTSE 100, DAX40, Gold and the S&P500, including the trades that I am looking to take myself, then please join my active members community.
Keep up to date with new website posts, free sign up below
