
Technical analysis for 4th June 2026
The tone has shifted slightly from yesterday. The US indices are still in primary uptrends, but they're now showing signs of short-term exhaustion and consolidation. DAX has turned weaker, FTSE remains the weakest equity index, and Gold is attempting a counter-trend bounce inside a broader downtrend.
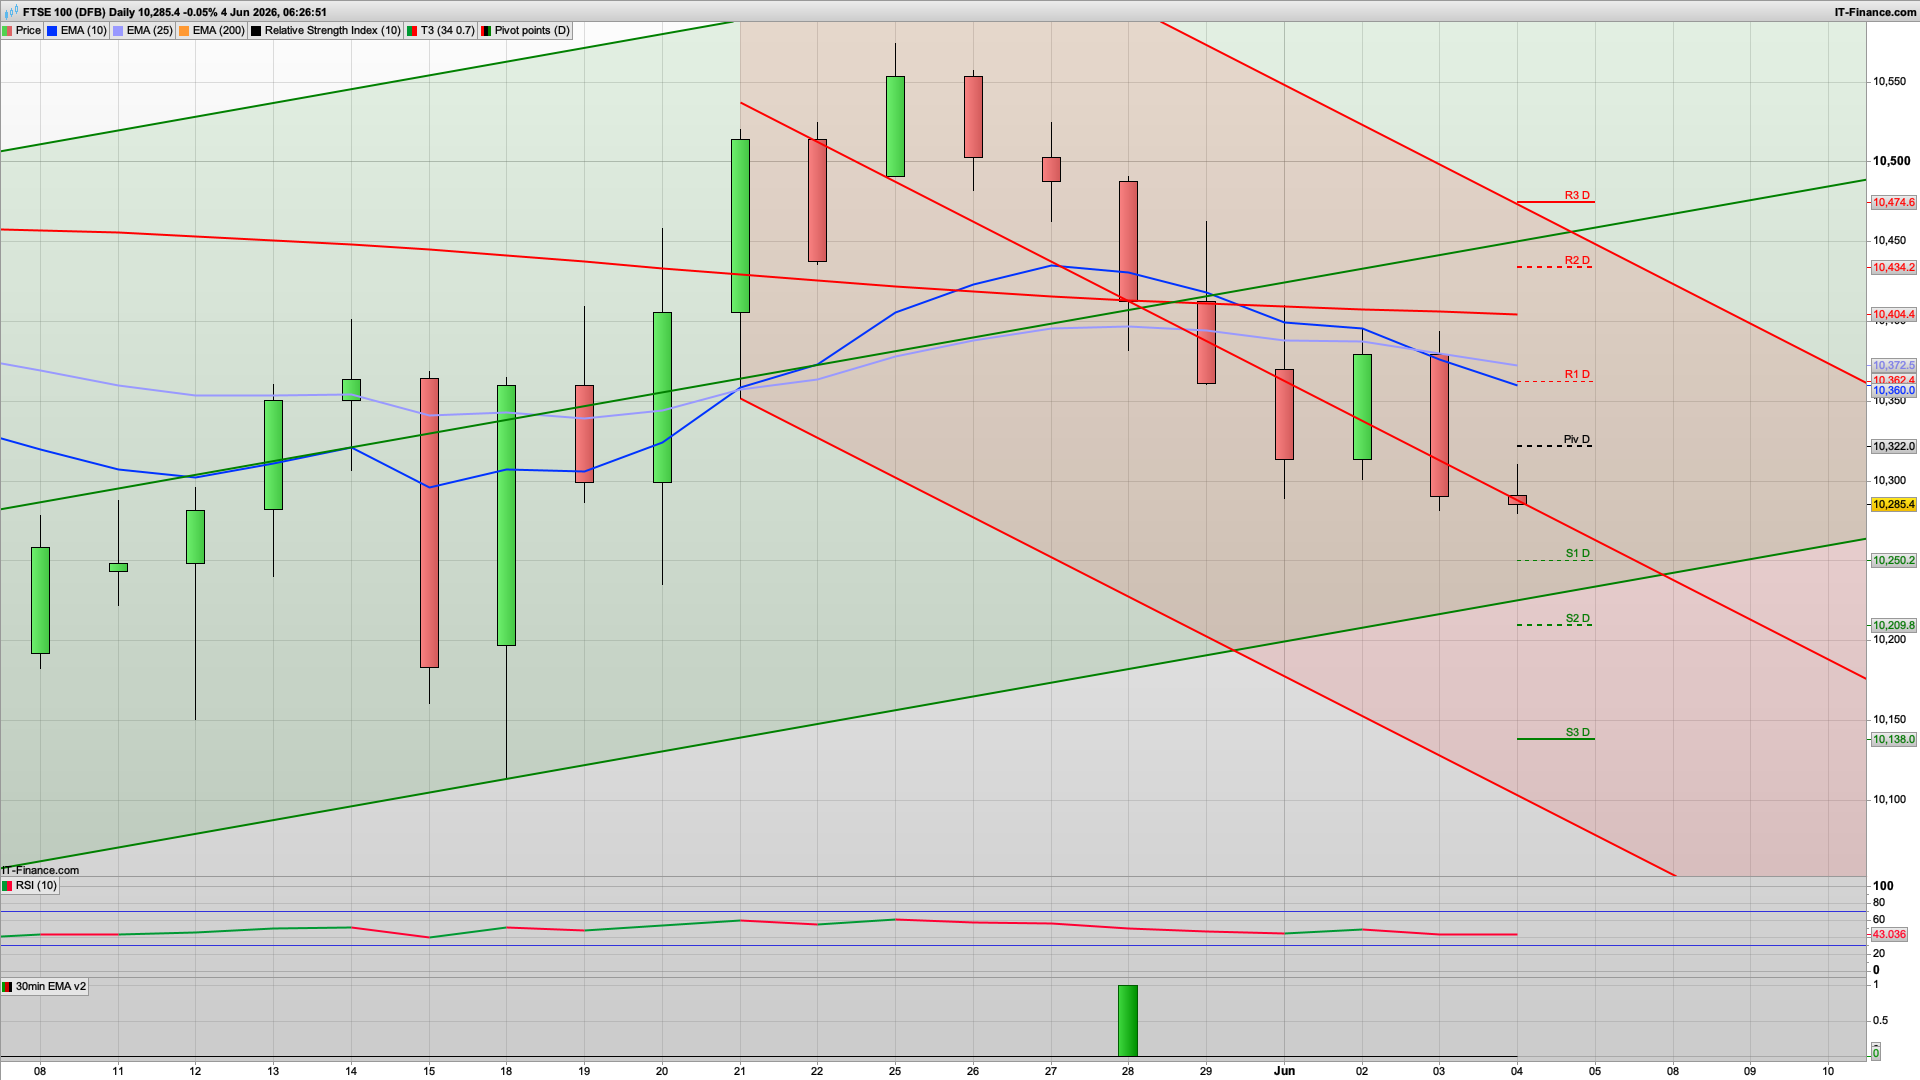
FTSE 100
- Bias: Bearish
- Technical View
- Clear descending channel.
- Trading below both moving averages.
- Lower highs and lower lows continue.
- Relative weakness versus DAX and US markets remains obvious.
- Technical View
- Key Levels
- Resistance: 10,322 → 10,362 → 10,404
- Support: 10,250 → 10,210 → 10,138
- Trade Plan
- Sell rallies into resistance.
- Only a move above 10,360 would improve outlook.
- Target: 10,250 then 10,210
DAX 40
- Bias: Bearish / Sell Rallies
- Technical View
- Large bearish rejection candle on 3 June.
- Price now trading below pivot (24,821).
- Testing the 25 EMA area.
- RSI has rolled over below 50.
- Technical View
- Key Levels
- Resistance: 24,821 → 24,989
- Support: 24,668 → 24,517 → 24,349
- Trade Plan
- Below pivot: favour shorts.
- Recovery above 24,821 would neutralise the bearish view.
- Target: 24,668 then 24,517
Nasdaq 100
- Bias: Bullish (but consolidating)
- Technical View
- Trend channel remains strongly higher.
- Price still above rising 25 EMA.
- Yesterday's candle was profit-taking rather than trend reversal.
- Buyers remain in control while above 30,300.
- Technical View
- Key Levels
- Resistance: 30,688 → 30,956 → 31,152
- Support: 30,224 → 30,115
- Trade Plan
- Buy dips near pivot zone.
- Bull trend remains valid unless 30,200 breaks.
- Target: 30,688 then 30,956
S&P 500
- Bias: Neutral-Bullish
- Technical View
- Strong uptrend still intact.
- Large bearish candle yesterday damaged momentum.
- Currently sitting around the 25 EMA.
- Market deciding whether yesterday was a pullback or start of a larger correction.
- Technical View
- Key Levels
- Resistance: 7,592 → 7,653
- Support: 7,494 → 7,455
- Trade Plan
- Above pivot (7,554): bullish recovery possible.
- Below 7,494: sellers likely gain control.
Gold
- Bias: Neutral-Bullish (short-term), Bearish (larger trend)
- Technical View
- Price bouncing from lower channel support.
- Bullish daily candle forming.
- Still below falling EMA structure.
- Counter-trend rally rather than confirmed trend reversal.
- Technical View
- Key Levels
- Resistance: 4,489 → 4,530 → 4,562
- Support: 4,456 → 4,416
- Trade Plan
- Above pivot (4,456): favour intraday longs.
- Major trend remains bearish until above 4,530.
- Target: 4,489 then 4,530
Best Trades Today
- DAX Short
- Entry below 24,821
- Targets: 24,668 → 24,517
- FTSE Short
- Entry below 10,322
- Targets: 10,250 → 10,210
- Nasdaq Long
- Buy dips above 30,224
- Targets: 30,688 → 30,956
- Gold Long (counter-trend)
- Above 4,456
- Targets: 4,489 → 4,530
For today's session, the strongest directional theme is US tech strength versus European weakness, with Nasdaq preferred on the long side and DAX/FTSE preferred on the short side.
Interested in how to start trading the FTSE 100? Frequently Asked Questions on Spread betting
Recommended Broker for trading - MT4/5, web and mobile

IC Markets - offers market leading pricing and trading conditions by providing clients with True ECN Connectivity; this allows you to trade on institutional grade liquidity from the world’s leading investment banks, hedge funds and dark pool liquidity execution venues. Highly recommended!
Join my Membership for Trading Tips, Support and Resistance Levels with Live Trading
If you would like more detailed analysis for FTSE 100, DAX40, Gold and the S&P500, including the trades that I am looking to take myself, then please join my active members community.
Keep up to date with new website posts, free sign up below
