
Technical analysis for 7th April 2026
FTSE 100 — Bullish (relative strength leader)
- What’s happening
- Strong impulsive move up
- Holding structure inside rising channel
- Only minor pullback candle
- Read: Cleanest structure of all indices
- Bias: Buy dips
DAX — Neutral → Bearish (fading strength)
- What’s happening
- Trend still down overall
- Price pushed into rising channel resistance + pivot
- Small bearish reaction candle forming
- Read: Rally is corrective, not a reversal
- Bias:
- Below pivot → Sell rallies
- Needs strong break higher to turn bullish
NASDAQ — Neutral (range / base forming)
- What’s happening
- Holding above recent lows
- Sitting on pivot + EMA cluster
- No strong rejection yet
- Read: Market is pausing, not trending
- Bias: Range / wait
- Break up → short squeeze potential
- Break down → trend resumes
S&P 500 — Neutral → Slight bullish intraday
- What’s happening
- Higher lows forming
- Holding above short-term support
- Attempting to base
- Read: Early recovery attempt
- Bias: (weak)
- Above pivot → buy dips intraday
- But still within broader downtrend
GOLD — Neutral → Bearish bias
- What’s happening
- Bounce into trendline + resistance
- Stalling around pivot
- No strong continuation
- Read: Likely lower high forming
- Bias:
- Below pivot → Sell rallies
- Needs breakout to flip bullish
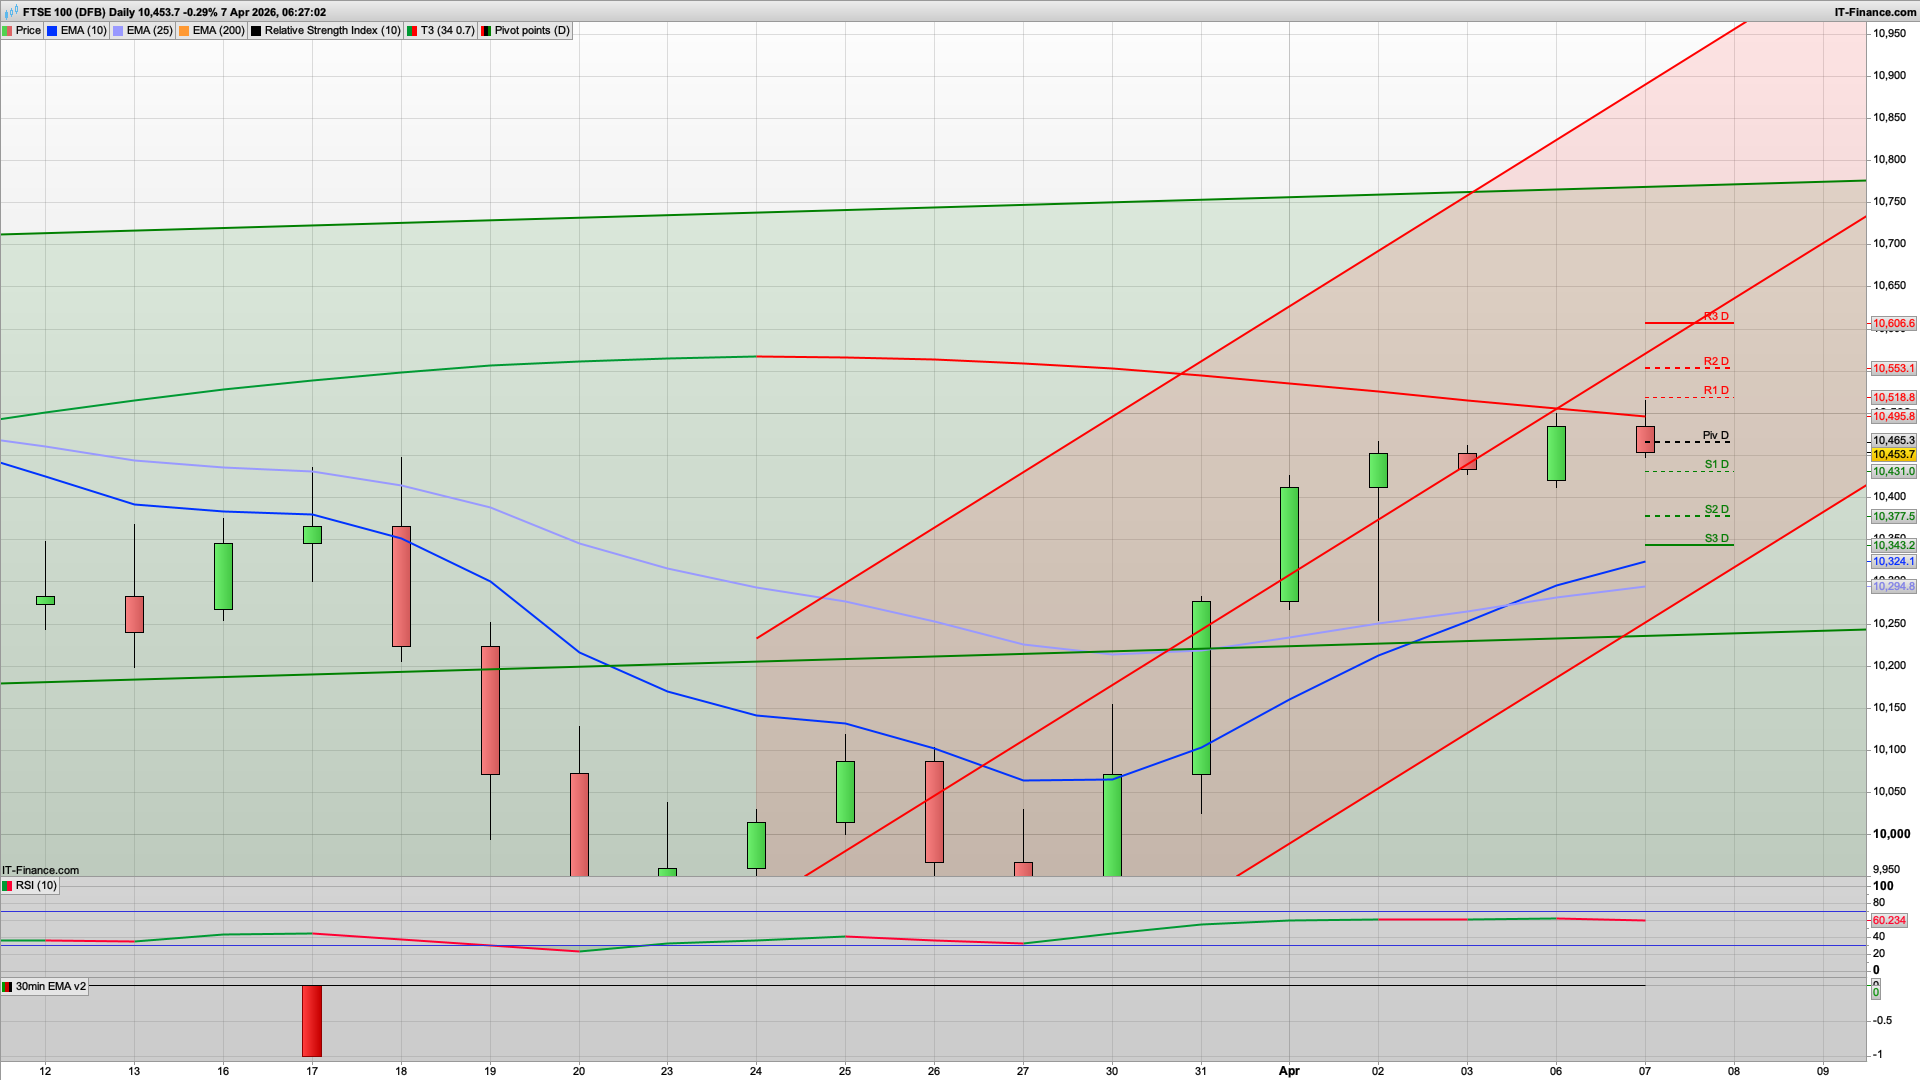
It's looking a very different day versus the prior bearish setups - we’ve now shifted into a controlled bullish structure inside an ascending channel. Daily EMAs are bullish now too with 10300 support, but the shorter timeframe 2h chart is bearish with Hull MA resistance at 10545. We also have the "Trump deadline" looming this evening so a turbulent geo-political outlook still.
Initially today we have the daily pivot at resistance at 10465 and we could see a drop off this to test the 10431 S1 level but there is also a possibility of a bear Tuesday to start with and we dip as low as 10381 to test S2 and the 30m 200ema. If we do see this level I am liking a bounce here to recapture 10400 and another test of the daily pivot. It's a positive sign for the bulls that we have pushed above 10400 as that (in theory) opens up a rise towards the 10565 level. Above that then there is a chance for a rise towards 10934 again....
Resistance wise to start with, in addition to the daily pivot, we have a red 30m coral at 10486 then 10518 R1 and also the overnight high last night. The bulls will of course be trying to push above this and if they manage to do so then I am looking at the 10565 area and just above R2 at 10553. If we see another TACO (Trump Always Chickens Out) with regard to the Iran deadline then the bulls will certainly be looking to push higher. The indices markets is almost resuming to business as usual now and ignoring the Middle East and the technicals are starting to have a bearing again.
Oil continues its rise obviously though and now around the $109 area - though in turn helping BP and Shell and the wider FTSE100.
Good luck today.
Interested in how to start trading the FTSE 100? Frequently Asked Questions on Spread betting
Recommended Broker for trading - MT4/5, web and mobile

IC Markets - offers market leading pricing and trading conditions by providing clients with True ECN Connectivity; this allows you to trade on institutional grade liquidity from the world’s leading investment banks, hedge funds and dark pool liquidity execution venues. Highly recommended!
Join my Membership for Trading Tips, Support and Resistance Levels with Live Trading
If you would like more detailed analysis for FTSE 100, DAX40, Gold and the S&P500, including the trades that I am looking to take myself, then please join my active members community.
Keep up to date with new website posts, free sign up below
