
21st February 2017
FTSE 100 Support 7290 7280 7266 7261 7238
FTSE 100 Resistance 7302 7303 7320 7334 7359 7369
Good morning. As expected it was pretty flat on the FTSE 100 yesterday with the US closed for Presidents Day, however it was slightly bearish dropping off from the 7320 level to a low of 7383 before hovering around 7290 for most of the day. Managed a few points from our long though so that was good. Gold stayed around the 1238 area but has dropped off overnight, have just closed the short at 1234.
Should have a bit more movement today with the US back from their day off. We also had the Lords starting the Brexit debate yesterday, while the bears will be buoyed by the fact that the FTSE 100 continues to lag its peers while they are making new highs – there is also a doji candle on the FTSE 100 daily chart now, which can possibly signal a reversal.
FTSE 100 Outlook and Prediction
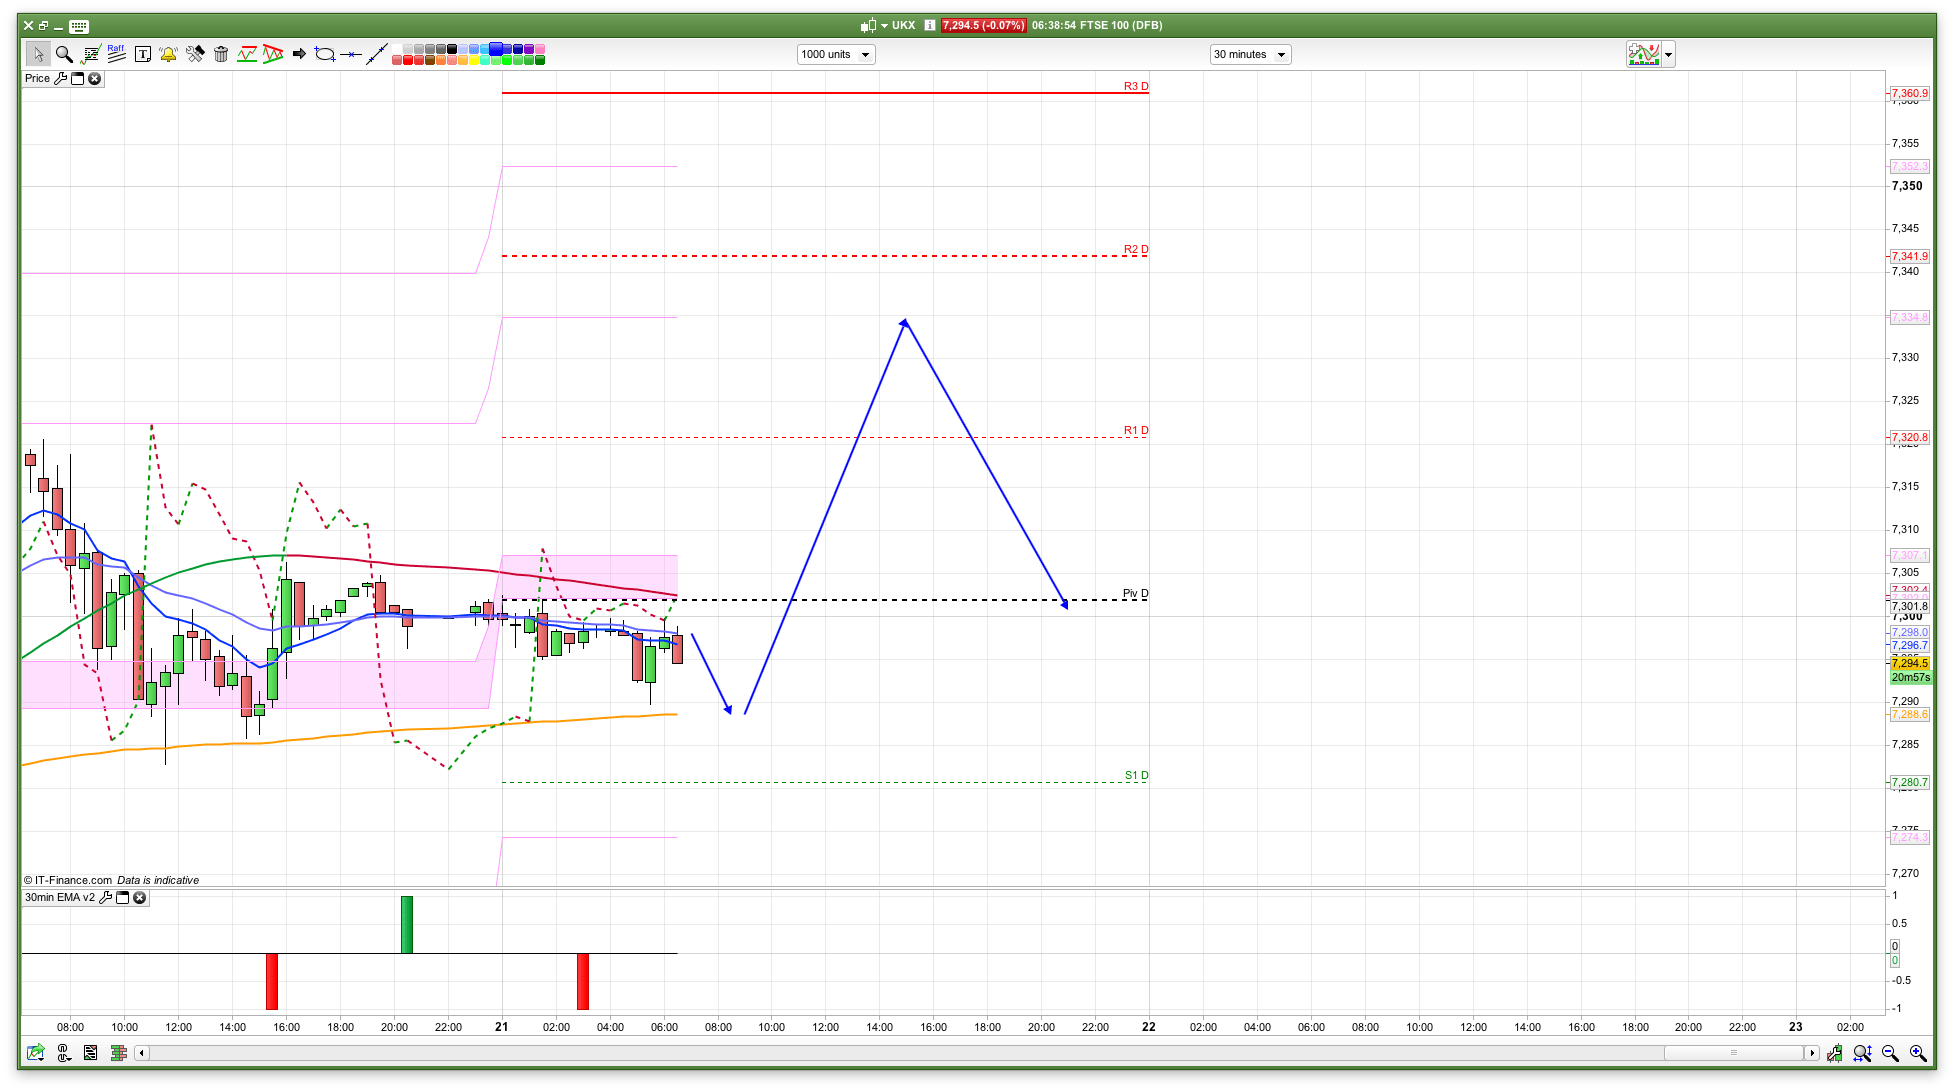
For today we should see some more movement. I have initial resistance at 7334 with 7359 above that, and if the bulls manage to get the price to those areas then they are worth a short I am thinking. Support wise, we have the bottom of the 10 day Bianca at 7290 again, with 7280 just below that for S1, and the 30min 200ema (which held yesterday) between them at 7285. The doji candle pattern on the daily chart “can” signal a reversal so we might well be topping out here short term, especially as the FTSE hasn’t retested that recent high at 7355, nor followed the S&P higher as its made its new highs.
So, have a cautious long on for the 7280 level, but am thinking that shorting the rallies is a good mindset. The usual pattern recently has been bull Monday, bear Tuesday, though there wasn’t much bull yesterday. However we do have another large dividend this week, 26 points this time.
The ASX200 had a fairly weak Tuesday session also, with a general down trend.
If the bulls can get the FTSE to close above 7340, then it keeps the uptrend viable, however, the longer we stay below 7310 then the more likely we will get a bit of a pull back. The daily RSI has dropped off a little after yesterday to sit at 64 currently.
If the 7280 support breaks then it will be worth flipping to short as we may well get a dip to 7238 or lower.