
8th January 2018
Want to discuss things with other traders – please visit the forum here for todays discussion
Friday worked out well with the short managing to pretty much catch the high, though the bulls are still in control and pull backs are shallow. Overnight we have seen the FTSE 100 futures reach a high of 7730 but drop back a bit, and should they break 7726 during todays market session then I expect we will reach 7752 where we have R2 today and the first fib level. There are some bigger picture outlooks that point to a bit of a pull back from around this level, which would tie in with a drop down to the 25mea on the daily at 7587 before another push higher. Generally still feel pretty bullish for this year, unexpected news notwithstanding. U.S. equities posted the biggest weekly gain in a year last week to close at record highs.
Analysts see Asia’s earnings season boosting the region’s equities even further: profit estimates for all sectors were increased over the last three months of 2017. Asian companies reporting this week include Samsung Electronics Co. and a slew of Japanese retailers and manufacturers, although Japan’s markets are closed today.
FTSE Outlook and Prediction
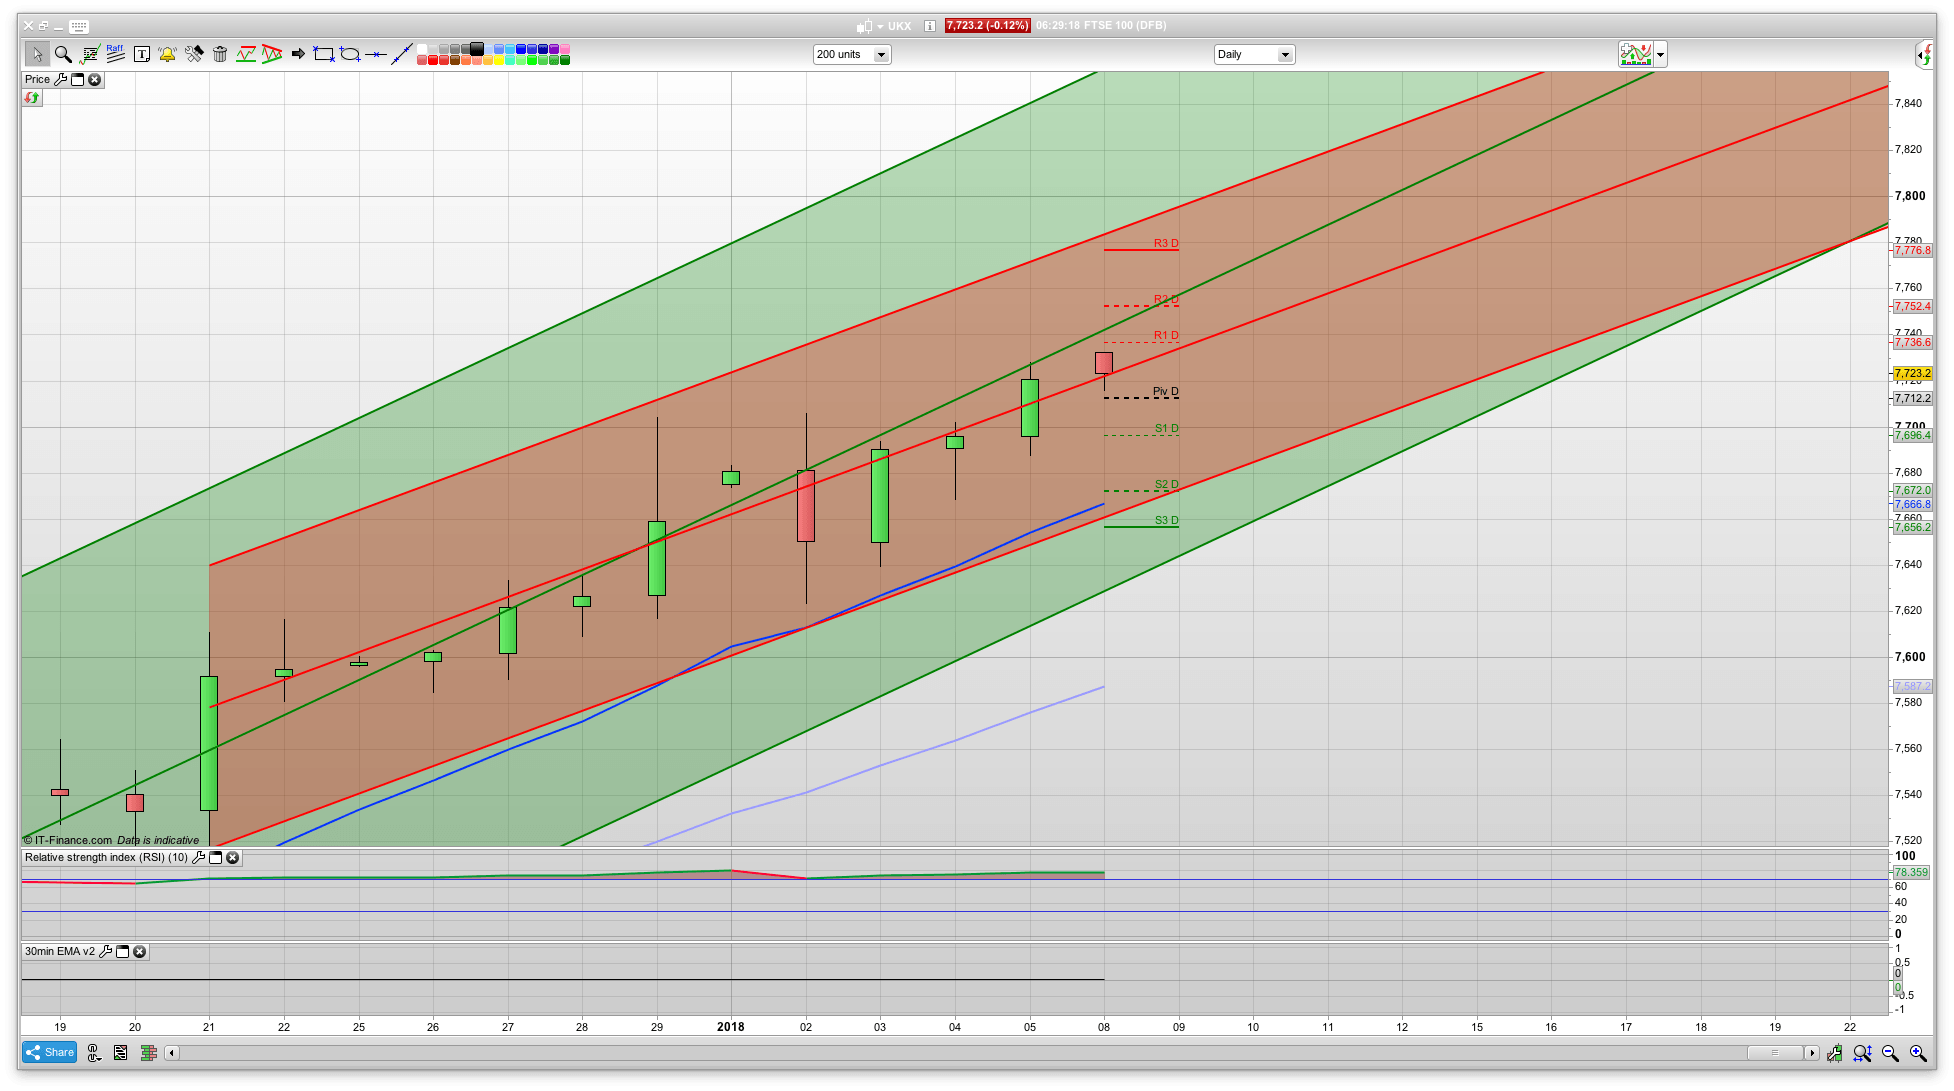
To start with today it looks fairly bullish for a rise towards the 7750 resistance area. Fridays high was broken overnight though we have had a pull back from the 7736 area (small one though!) and the 2 hour chart is still positive. It will be interesting to see what the FTSE 100 does at the 7752 resistance level as we are just above a fib level there as well, though the next resistance fib above that is 7767. R3 is 7777 so there are quite a few key resistance levels fairly close to the key looking 7750 area. Last week was strong all round, setting a positive tone for 2018 (still thinking FTSE will see 8000 this year) and for the moment buying the dips is still a good plan.
If the bears were to break 7685 where we have the 200ema on the 30min chart then we may well get a bit more of a pull back to the 25ema support area on the daily chart which is at 7587 currently. Both the Dax and the S&P are still nudging the top of their respective Raff channels, but as the FTSE has lagged their bullishness over the past few weeks, we are only around the mid point of ours. So we are either lagging them and will follow them down if they drop back or they stall a bit here and we rise further towards 7800 to catch up. The Dow has managed to surpass the 25,000 level pretty easily and pull away from it. Basically its all bullish at the moment! Which logic says is the time to be fearful, however, that argument has been trampled over the past 12 months…….
Membership
Want more detailed analysis for FTSE 100, DAX, Gold and S&P? Then please join our active members community.
What you get
- Daily Analysis pre market open (sent around 7am each day) for FTSE, DAX, Gold and S&P.
- Daily email pre market includes my trading plan for the day including ORDER levels, with stops and targets/limits
- Telegram Chat room and webinar group membership for discussion and realtime trade updates