
Good morning. Well the FTSE wasn’t quite as bullish as it could have been, failing to break the 6710 area, but spent most of the day fairly flat with the 6672 support area holding till after hours. Fortunately yesterdays S&P trade worked well, running to target at 2108 before falling back. Gold didn’t fair so well though, which continued falling while indices did in the latter stages of the US session. Greece’s stock market reopened and immediately had its biggest ever fall, 22%. For the FTSE 6730 still looks like the main resistance area for the bulls to break, with a rise to 6780 possible.
US & Asia Overnight from Bloomberg
Asian stocks dropped after Brent crude slid below $50 a barrel for the first time since January, dragging commodity producers lower.
The MSCI Asia Pacific Index declined 0.3 percent to 140.70 as of 9:05 a.m. in Tokyo. Australia’s S&P/ASX 200 Index slipped 0.2 percent ahead of Tuesday’s central bank interest-rate decision. Chinese stock-index futures fell after regulators imposed limits on short selling on Monday in its latest effort to suppress volatility.
Speculation Iran could boost oil output soon after sanctions are lifted and mounting concern over slowing Chinese economic growth fueled commodity losses, with energy and materials shares sliding around the world. The plunge in oil and data, indicating a pullback in U.S. manufacturing, bolstered the case for keeping American rates lower, as the Federal Reserve mulls its first increase since 2006 as early as next month.
“Renewed Chinese growth concern is driving commodities and stock prices lower,” said Matthew Sherwood, Sydney-based head of investment strategy at Perpetual Ltd., which manages the equivalent of $24 billion. “With earnings season concluding this week, all eyes are likely to look back at the clouded macro picture. China and Greece remain problematic and the U.S. Fed is likely to remain at the forefront of investors’ concerns.”
Japan’s Topix index retreated 0.3 percent. New Zealand’s NZX 50 Index fell 1.1 percent. South Korea’s Kospi index rose 0.2 percent.
Australian Rates
While most economists predict the Reserve Bank of Australia will leave the benchmark cash rate unchanged at 2 percent at its meeting on Tuesday in Sydney, Stevens has said the option of further easing remains on the table. Swaps markets are pricing in about a 90 percent chance of a reduction in the next year, data compiled by Bloomberg show.
Contracts on the FTSE China A50 Index fell 0.4 percent in most recent trading. With mainland Chinese stocks dropping for six of the past seven days, regulators announced the short-selling restrictions after markets closed Monday. Those who borrow shares will have to wait a day to pay back the loans, according to statements.
Futures on Hong Kong’s Hang Seng Index decreased 0.2 percent and contracts on the Hang Seng China Enterprises Index of mainland firms listed in the city added 0.1 percent.
E-mini futures on the Standard & Poor’s 500 Index slid 0.2 percent after the underlying gauge yesterday retreated 0.3 percent. [Ref]
FTSE Outlook
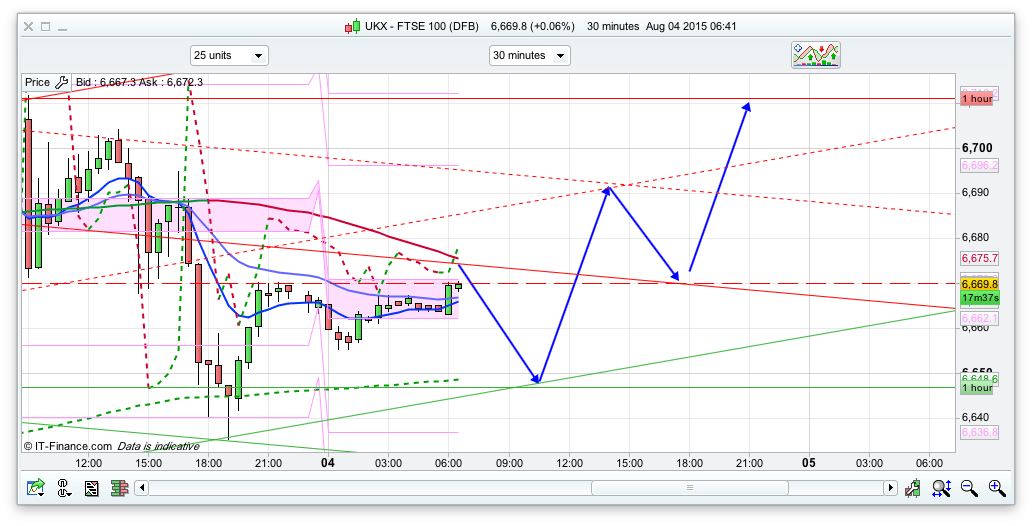
Yesterday high at 6710 will be the level that the bulls need to break, for a push to the 6730 area. If they manage to break this the the top of the Bianca 10 day at 6780 looks likely to get hit, as we also have the daily 200ema and top of the 20 day Raff here. As such looks a good place for a short. The daily pivot is 6671 today, pretty much where we are as I write this, so we may have a pull back from here initially, possibly back down to the 200ema area on the 30min at 6650. We also have the bottom of the rising 30min channel that held yesterday at this level, so i have gone for a fairly bullish play off this level. Below this then 6625 is a fairly decent support level, though looking at the 10minute chart its a fairly bullish start as I am writing. so, 6648, 6710, 6730, 6780 all look like the main areas for action today.
Morning all.
Good hold of 40/50 followed by a buying spree!
Arrows spot on so far Nick.
#FTSE long from 6648 closed 6705 #happymembers
Thanks tmfp; shorted the open at 6680 down to 6650 as well 🙂
Yeah I caught that opening short too, but covered too early and didn’t long.
So, another attempt on 10 on the cards….
Will it, won’t it…..
Morning All,
I’m sure you’re on this …
RSI Trio on 1 min & 2 min
Trading against the trend which seems strong so some patience needed perhaps.
Sure Hugh, but the trouble is that when it’s showing this action then it can burn off the RSI sideways without the price dropping much.
I actually just took 10 off a 6700 long lol.
Once again, I’m trialling my reverse engulfing candle theory to avoid looking for pullbacks/changes of trend which aren’t there.
If you have a look at the 5 min 09.30 candle, you’ll see that we haven’t closed lower than its opening 6701.9 in the last 40 mins or so.
That engulfed correction after a 75+ pt move makes me a little cautious on rsi signals.
Yes – I know you’re right pointing this out.
My head isn’t really in the game at the moment ! I’m trying to work as well !
As there aren’t many of these signals at the moment and I always seem to regret not taking them – hence – saw it – Shorted it .
Tgt maybe to 6680.
Closed for 15 . RSI 6 – 1 min .
Good shout, not meaning to discourage you, everyone in the world should be short 🙂
What I am interested in doing is to try and establish the relationship between the rsi initial signal and the ensuing move in this sort of market action.
Those very short term signals were 90 minutes ago, and only now is a short showing any money.
Are they related in any way, or is the actual move just another failing attempt to get through 6710, which just coincided with the rsi showing vastly overbought because of that weird rise from nowhere? .
6670 – I’ve almost got another RSI Trio Here – Just not got a close below 30 on RSI 31 (1 min).
Well that’s three of your arrows Nick, you’re wrong about the fourth one though 😉
75% pass rate though. I think thats an A isn’t it?!!!
Is this a rise off 6670 though?!!?
That’s what it’s trying to do, but not exactly roaring away atm.
I suppose the next direction will come from the DOW which had an interesting session yesterday.
I must admit I didn’t appreciate how poorly the DOW is doing until watching it yesterday.
I mean they’re only ~150 points off July lows compared to us +270 and the DAX +750.
It closed a nice gap at 72.5 from first thing this morning. There’s another gap at 87.8 on the 5-minute that could be a marker for the next rise to that area. The 2-hourly candles so far have retraced the previous candle confirming the sideways action so I’m looking for this to be possibly hit sometime in the next 2 hours unless the US want to take us lower first.
V. nearly got a 2-hour sell signal this morning, but that weird rise negated it or more likely postponed it for a bit longer. If we see more sideways action rather than up, up and away, I’ll be putting my bear goggles back on.
LOL as opposed to beer goggles 🙂
Exactly!
This one has a better likeness 🙂 http://s172.photobucket.com/user/zigzagger2/media/bg_zpsby9rbesp.jpg.html
🙂
Filled your gap ZZ, now can get down to the serious business of going through the floor 🙂
come on down … paleeze 🙂
As an aside, I am just in the process of going live with a share service – https://www.hilsdentrading.com/uk-share-analysis. Basically giving buy levels for FTSE 100 shares, based on technical analysis.
Good Luck with that 🙂
All the best with that Nick — would make a good on-line service too? 😀
Thanks, and yes it might well do!
If I ran it, it would just be a web page with “NONE” written on it.
LOL! Got us into Sage and Easyjet the other day and both now in profit. Got a Tesco buy at 208.8 currently sat as an order