
Good morning. Fairly bearish day in the end yesterday, though a bounce on the S&P at the close from the 2100 area I was looking for might be gaining some traction. Will find out today! We are also at the bottom of the 10 day Bianca at 6624 so will be interesting to see if these levels hold.
US & Asia Overnight from Bloomberg
Asian stocks fell, with the regional benchmark index extending its weekly decline, as the commodities rout deepened with oil entering a bear market.
The MSCI Asia Pacific Index fell 0.2 percent to 143.38 as of 9:11 a.m. in Tokyo. The gauge is headed for a 0.9 percent decline this week as global equities traced losses on commodity markets, where concern over supply gluts sent gold to industrial metals and oil tumbling. Adding to commodity investors’ pain is the resurgent dollar, with focus shifting to next week’s Federal Reserve policy meeting amid buoyant economic data. U.S. stocks fell for a third day as earnings results from 3M Co. and Caterpillar Inc. disappointed.
“With the U.S. dollar likely to keep rising as the Fed prepares to raise rates, there’s still some sort of weakness to come in the commodity space,” Angus Gluskie, managing director at White Funds Management Pty in Sydney, who oversees $550 million, said by phone. “The earnings outlook in the U.S. is also somewhat subdued as a result of the strong U.S. dollar. We’re not likely to see a massive rally in the next few months.”
Japan’s Topix index slid 0.2 percent and South Korea’s Kospi index dropped 0.7 percent. Australia’s S&P/ASX 200 Index fell 0.4 percent. New Zealand’s NZX 50 Index slipped 0.1 percent. Markets in China and Hong Kong have yet to open.
The Shanghai Composite Index rose for a sixth day on Thursday, climbing 2.4 percent and sending the benchmark index to its longest stretch of gains since May, as unprecedented government intervention to support equities took root. The Hang Seng China Enterprises Index of mainland shares traded in Hong Kong advanced 0.9 percent.
China Manufacturing
A gauge of Chinese manufacturing due Friday may confirm the sector contracted for a fifth straight month in July.
E-mini futures on the Standard & Poor’s 500 Index gained 0.1 percent. The U.S. equity benchmark index retreated 0.6 percent on Thursday.
The earnings season has been spotty for U.S. companies so far, with sluggish demand overseas damping returns for some multinational companies. Disappointing results from Apple Inc. and Microsoft Corp. earlier in the week sparked a selloff in technology shares. [Ref]
FTSE Outlook
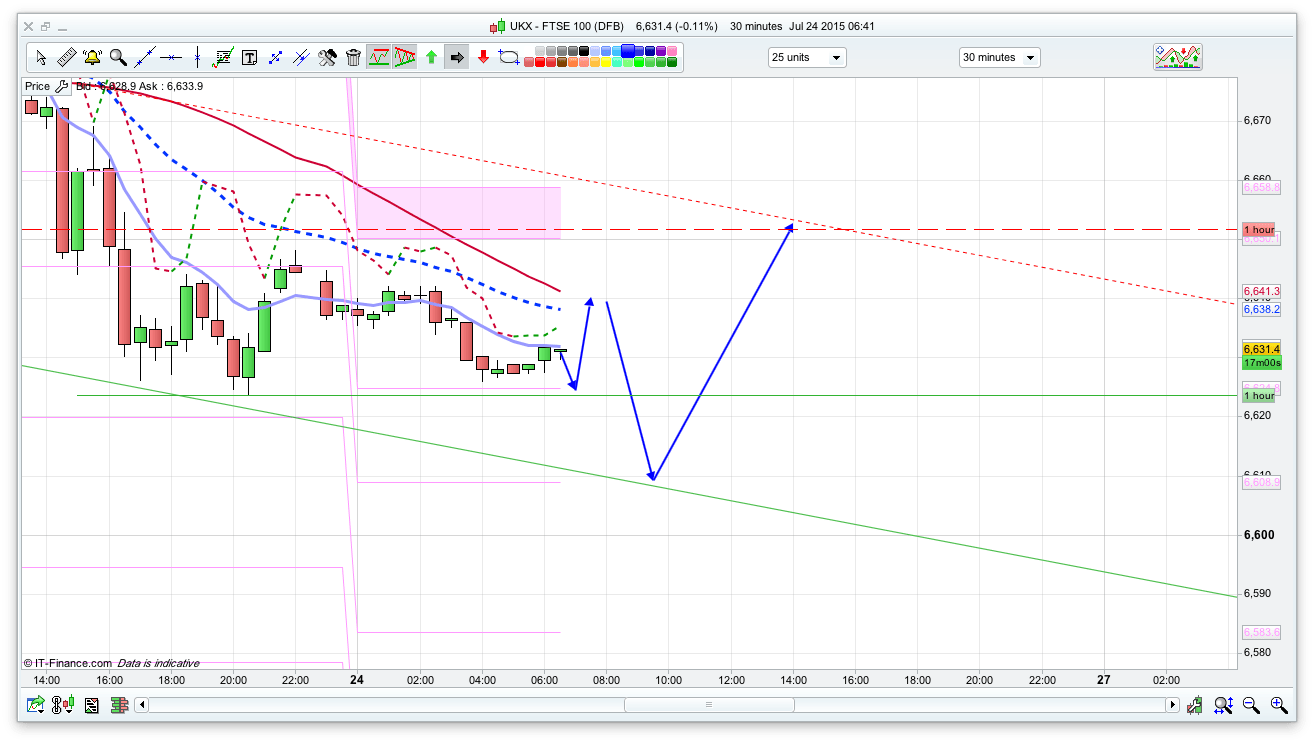
6624 is the bottom of the 10 day Bianca channel and has held so far though there is a decent 30min channel also in play, with support at 6610 (along with a fib level here) and resistance at the 6655 area. The moving averages are bearish to start with and the T3 coral line is also showing resistance at 6640 initially which might scupper any early rises. I have put in a dip to 6610 with the arrows but I do feel about 50% sure that 6624 is going to hold, especially with the S&P bouncing off the 2100 level to 2106 this morning. The bulls will need to break 6634 first thing for 6624 to hold.Generally feeling a bit bullish today, though if 6610 and 2100 on the S&P break then I think we will head down to 6550 and 2090.
Morning what do you guys think,I’m feeling bullish for a change:)put my long back at 40 🙂
I want my 75 🙂
Hey tmfp,it’s kind of like not having a stop 🙂
Now we’ve just broken through 55 and looking fairly positive for 70ish, think about where you would consider the up move over and failed.
Personally I’d be thinking a drop below 47 would neutralise the uptrend short term, and probably put a stop at 45.
Stops don’t only limit losses, they protect profits 🙂
GL I’m out till later.
Thanks buddy
I covered 2/3 of my supposed long term short yesterday at 54 and 27 looking for a bounce and replaced 1/3 just now at 54, the other 1/3 they can have back around 70 which I think will become resistance, although a run to 6700 isn’t out of the question for me.
I’m with Nick on 24 holding today, but a break of that taking us to high 6500’s pdq.
A couple of good IG analysts are saying now that Greece is yesterday’s news (apart from if you live there 🙁 ) the weakness in global commodities will be the next fixation.
I couldn’t agree more, how can you have a global economy supposedly growing at 3.5% pa and the raw materials needed for that growth being given away?
Makes no sense.
Any downgrade to that 3.5% forecast could be the catalyst for further downside imo, although that’s not going to happen tmrw.
Looking a bit more positive this morning. 10 min TSI has been above zero since 7.00am, but it doesn’t give me the feeling that we’re off the the races. Need to see how the opening 5 min candle breaks. We spent two hours on Weds trading within the first 5 mins before dropping. Could do the same? PS. I’m still expecting a visit to 6600 sometime. Interestingly where it stopped overnight was at last week’s low. Big boys will not want to see a close below last week’s low if they can help it.
I’m going to short at 6685 (if seen). This is the same size as the previous retrace we had Wed/Thurs, so it may peter out there. If the retrace exceeds that then this bull has legs.
Closing my shot at 65, stop moved to 80.
and out …
Morning – Just at the moment I think we’re range bound 6647 – 6655.
Gone Long 6659
– Not totally happy about the entry price but I think we’re heading higher.
– Stops in & watching
Anyone got any targets – I’m eyeing up 6680 area ?
Out at target at 75 🙂 regained loss from yesterday and made 9pts
well done mate.
Thanks Senu
Nice one Anstel – Had to nip out so I set Limit at around this area. Dun & Dusted.
Where to now ??
Thanks Hugh
I’m staying out now to see where the dust settles…….depends on what the Dow does I reckon
Ok I’m going to try some scalping from 65 aiming at 3points profit small stakes
Out for 3 points 🙂 that’s dinner 🙂
Very small short at 69.5 out for a bag of crisps 🙂
Long 71.5 bigger stake think Dows waking up
No pain no gain 🙂
anstel, this is called over-trading. Avoid it.
Thanks Senu I think it’s going to rise though.i know it looks doubtful now though,but I appreciate your advice thanks very much
I know I give the impression I’m too cavalier but I’m deadly serious behind the facade.
I think tmfp is shorting again from his mobile lol 🙂
you still holding your long @ 71.5?
At the risk of getting told off yes I’m surfing the waves Senu.its not a big enough pounds per point to upset me yet.It has turned out to be a very bad entry but I’ll make on it I reckon.
brave man.. good luck
Back in the seat – – got called away rather unexpectedly.
So what have we …. negative charts – anstel are you still Long ??
Riding the waves Hugh riding the waves,it’s a bit choppy.
Measured move down (same size down as yesterday) will take us to c6600-6605. Not saying it’s going to do this – but it’s worth watching if 23 breaks.
Yep – Still seeing neg. charts
10 Day Bianca at 6624
No idea about Bianca (whoever she may be) but my 10 min Jagger-Zagger turned negative at 54 🙂
Jagger zagger love it:)
Good job I’m on a rolling contract 🙂
Jagger-Zagger is telling me to go long at 6600-6605. Stop at 6590.
Oh good Its about time somebody pressed the buy button
ZZ – Nothing good on my chart.
Decided to the Cam Levels Short Trade
S 6617 to S3 Trade 6562 (not there obviously yet) Stops In.
Yup. Be v. surprised if the plunge protection team allow a sub-6600 weekly close. Let’s see.
I know Hugh – when it looks really bad now is the time to buy. Stakes are miniscule – lots of small gaps up to 6620 – gut feel or it may be my stupidity 🙂
Best gap is at 6615.3 on 5-min and 10-min chart. Will set my stop to breakeven there or exit the long depending how I feel.
Closed Short Around here – 6595.
Have a good w/e everyone.
Just as a point of interest last year starting on 31st July the Dow had a big drop,can’t remember how much I think it was in the region of 500pts or so
Hello chaps, looking a bit sh*t isn’t it? Or great, depending on whether you sold at 55 and 70 🙂 🙂 🙂
High 6500’s it is then?
In about 20 minutes, by the look of it………
Got my 6600 – Short from 6750 🙂 Doing an Anstel by removing my stop and waiting for the close. Longs are v. small.
Great Trade ZZ nice one
Excellent short ZZ congrats, the long’s a bit of a falling knife though.
Looking to cover 1/3 of short around the close if 70’s.
Blade-dodger’s my middle name 🙂
Gapman Bladedodger ZigZagger, a splendid handle 🙂
No Sweepstake today, one minute’s silence instead:
Bull Market
R.I.P.
lol… I am long @ 6600
Good man
Added 20% to my long at 85 get out of jail is now 6657
Calling bulls into next week 🙂
For slaughter
may be true..
Zigzagger, what about the gaps above 6720s?
6758 is the next key extreme daily gap above. Not going long for that yet. Need to wait for a 2-hour Jagger-Zagger signal to trigger. Can’t rule out 6550 or even 6295 first!
That gap is down Jun 29, and is the only gap, up or down on the daily timeframe through June-July to date . . . . . . . . 😀
Adding to my long @ 80, no stops now.
1/3 covered at 75, now off for a 300 mile drive in the rain.
6750 later?
Have a great weekend.
I will.
🙂
LOL BIG TYPO *6550*
Cheers 🙂
Hi Guys late I know this is not looking to good I’ve closed out and took the loss,I can get in again for the spread .i think there’s a drowning man here and no ones lending a hand Good Luck all
Why would it go up if EMA are strongly in a Sell situation and it’s Friday? Why would it go up if it’s a Selling trending day? The drop started below 200EMA and it falls like a brick now. Nick’s arrows for today were unrealistic from the start. I laughed in the morning thinking it’s too ambitions for Friday. Maybe on Monday we’ll get that almighty rise.
Greetings from a traffic jam.
If the DOW melts a further 100 in the closing hour, which is quite possible, there could be a brave bargain to be had.
I’ll be taking out another 1/3 of my short at 6515 if we get there.
Oh well, no meltdown tonight then, but I’ll leave the cover order on the platform for Sunday, maybe some vets will get margin called/windy.
Maybe a dead cat on Monday?
Hey anstel, we all trade in different ways, approach life differently.
I try and keep things simple. I’m here to make money, not run losses.
I have a plan/budget for every trade, a stop and a limit. If I’m seeing too much red ink then something’s wrong and I bin it and start again.
Have a good weekend.
🙂
Well the thing is Jack 2.most of the time when you fall in deep water your brother will lend a hand and pull you to safety.sometimes he even pulls you to safety when you don’t want him to.looks like my brother has just called but he might not stay.
Hey tmfp you nailed it mate very well done,I honestly thought there would be one last rise before it tanked.thats why I held that long but if my brother doesn’t lend a hand , or reaches out but then walks away well then I might have a problem my brother is around now but you know what family’s are like.If you get my drift and I’m sure you will.
Well if any of you guys are still around…..Same thing happened July 31st last year,this year it might be different Dow lost about 500 I was long rode it down and back up and made a profit this year I dunno,it’s 8 years since Northern Rock collapsed and the market collapsed soon after.Greece has had their can kicked down the road,Italy has manufacturing but are in a mess, the Pigs are a worry.ummn I might just have timed it wrong and tmfp has nailed it,I don’t know going to have a rethink next week.I don’t mind riding positions and it’s worked out well for me in the past but this time it doesn’t feel right so thats why I’m out.i only decided about an hour ago I can always get back in again.
FTSE-1hr — Got a buy. 6600 safe? 😀
Left-click on link: http://i1348.photobucket.com/albums/p736/jmca01/FTSE%20100%20DFB_zpswz855z9f.png
Good chance of a bounce on Monday/Tuesday. Daily low on Friday was 6574. 95% chance last week’s weekly candle will retrace at least 23% (6604). IG daily pivot is around 6594. Livecharts pivot is 6612. 5-min gap at 6615 which will act as a marker on a rise to that area. Stock Traders Almanac show the seasonality of the last 5 days of July to be up. Yes it can still go down further first if it wants to, but it’s very oversold short term. Statistically there may be a lower low ahead after a bounce. Will have to see.
Hey ZZ I have never once been this nervous about the Market,its not like me,dont know why,buying the Dip has always worked out over the past few years,maybe take some heat but overall its gone up.If i am going to trade now at all its going to be like tmfp Senu and yourself have advised ( a big thanks to all you guys) Stops and Limits small poition sizes and know my risk on each trade. Its not my style to trade in this way but without artificial support this Market is a timebomb waiting to explode.What we are all trading is not fundamentals,its not technical anaysis, its purely whether or not we have confidence in the artificial support.There are 88% of clients long at my brokers on the ftse.Call me cynical but what better time for a crash. Im thinking dead cat bounce then goodnight vienna.Whos going to short this when its 550 PTS of the highs a few short weeks ago? Yes im nervous!!!!!!
Anstel
On Friday….
What did your charts tell you ?
How are you interpreting your charts ?
As tmpf says – keep it simple.
Trade with the trend.
Higher Highs – Higher Lows = Uptrend
Lower Lows – Lower Highs = Downtrend.
Hi Hugh,the charts were bearish for sure,they are lagging indicators though, i have been short before when everything was indicating down and then suddenly the market changed direction and climbed and climbed and climbed.it was early feb 2014.This was not normal at all the market was on the verge of collapse but mysteriously recoved.my play on friday was based on seeing this happen and it being etched in my mind, I thought it was going to happen again, i was wrong Hugh but i was prepared to back my conviction with my money,It hit the high 70s dipped a little then dropped 120 pts or so.i made a right mess of that trade.i hold my hands up. We are dealing with alot of factors with what we are trying to do,in my mind its not all clear cut.i think we are in very dangerous times now! Friday i made a complete cock up no one to blame but myself and alot of you guys are very good on here, lets see what next week brings,i wish you all the best of luck.
There will come a time when the dip buying will turn into sell the rip time. I’m not convinced we are there yet. It’s not uncommon to see a summer low and then a rise into August/September. Spotting the low is difficult. We could be there now. Or it could bounce and drop again into the 6400s or go even lower to 6300. What I’m looking for is a low by about the first week of August and then a rise possibly all the way back up to the 6900s, but this only a guess. Never underestimate the power of the market to surprise either way. Buyers will step in when they spot a bargain and all the sellers have capitulated. Was Friday a capitulation day?
Hi guys! I’m a complete novice to all this and started demo trading last week and made a bit of £k (virtual unfortunately!) on a live feed spread betting on the UK 100 daily futures. I was astonished at how it dropped off the edge of a cliff at some points last week! Is this normal? Also, what’s the analysis software above that you show in the screenshot! It looks useful! I’d really appreciate and advice you all could offer me, no matter how basic! I know nothing! 🙂
Greg – The charts that Nick illustrates above are IT Finance / Pro Real Time charts available from IG Index.
I think they are available on the DEMO A/c – but you should check with them as a charge is normally made £30 /m unless you place 4 trades. Please check this as I’m not altogether sure.
Hugh, thanks a lot for this! Excuse my ignorance but don’t he different graphical options come with an explanation as to how they’re useful? I’ve made some demo money this week with a very simple strategy but I want to understand more in terms of understanding trend and predicting movement. Any tips anyone can give me would be greatly appreciated!
Hi greglongley,”Demo accounts dont give you any experience with the psychological side of trading your own hard earned money.”There are some experienced traders on here of which im not one but i think no one would disagree with that statement. I would also suggest keeping your pounds per point at the absolute minimum EVEN if you have a series of winning trades. I dont feel qualified to say anythng else but i think the guys will back me up with these two statements.
Hi Anstel. Thanks, that’s good advice. I’ve been putting £100 a point on my trades. Which I would replicate in ‘live’ trading, setting myself a loss limit of 10 points below my buy point to minimise any financial loss. I’m normally in and out of the market in 20 mins max, as soon as I’m in the green and a reasonable credit I cut out. Good point about the psychological aspect. I guess if I prepare myself to lose £1k then I can sort of accept it? Having said that… 🙂
Dont even think about putting £100 a point on, start on £1 per point.
Thinking 6520/6620 for Monday, probably won’t reach either but you know what I mean. Buying early weakness.
I’m just going to observe for a while but it will be interesting to see how things go.
Thanks Anstel
In an out of the market again this morning. Bought at 6513, sold at 6518. Profit albeit a virtual one 🙂 Sold just before it rose to 6530 and then sunk
Jeees looks like it’s shot up to 6525 now! Ugh! How can I tell if it’s likely to do that? Could have made a virtual mint!! 🙁